
Cumulative Layout Shift (CLS)
Cumulative Layout Shift (CLS) measures visual stability by tracking unexpected layout shifts on a web page as it loads. High CLS can make your site frustrating to use, causing visitors to accidentally click the wrong elements or lose their place while reading. This negatively impacts user experience and can hurt search rankings.
This guide is about how to use Request Metrics to solve CLS problems.
If you just want to learn more about Cumulative Layout Shift we’ve got you covered there too.
Request Metrics measures everything about Cumulative Layout Shift - from basics like the score, to more advanced metrics like “time after page load” and page lifecycle state. We even tell you the CSS selector for the element that shifted.
Layout Shift Values
Unlike many other metrics, CLS scores are not timings. They’re a decimal value that measures the sum of all unexpected layout shifts on a page, calculated by multiplying the impact fraction (how much content moved) by the distance fraction (how far it moved). It’s a somewhat complicated calculation, but we’re using Google’s own Core Web Vitals library to do it - so what Google sees, you see. And it’s like golf - you want the lowest possible CLS scores.
Percentiles and Histograms
As with page load, we show multiple percentiles when displaying CLS scores. Percentiles are a more reliable indicator than averages, since we can remove the outliers from impacting the data too much.
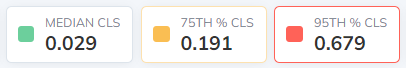
We also include histograms showing the Cumulative Layout Shift breakdown across your visitors.
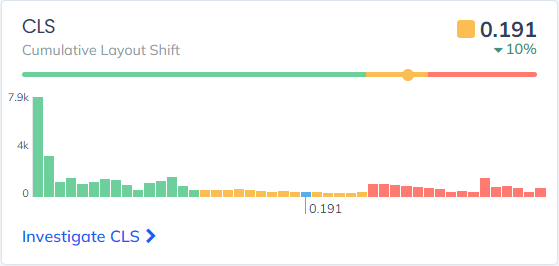
This way you can get a sense for how your CLS is distributed. Multimodal distributions can suggest problem areas that require further investigation.
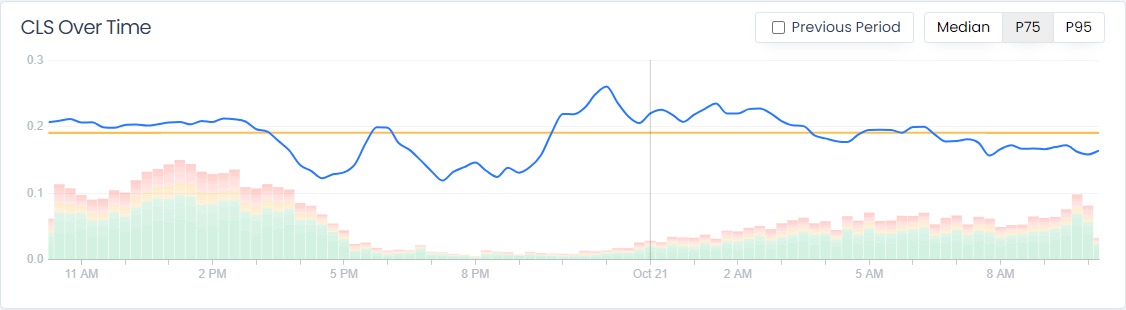
CLS Over Time
We also monitor CLS over time. It’s not uncommon for a marketing team or an ad provider to make changes that cause layout shifts, and ultimately regressions in your CLS scores.
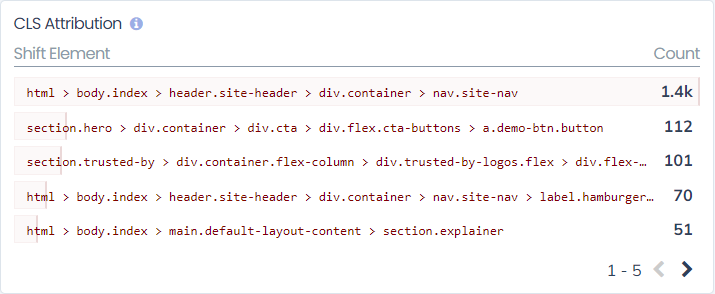
CLS Largest Shift Element Attribution
In addition to the cumulative layout shift score, Request Metrics also tells you the largest shift element for any given page. The largest shift element refers to the specific HTML element responsible for the most significant layout shift on the page. It’s the element that moved the most and had the greatest impact on the CLS score.
Run it in Your Browser
You can navigate to the page in question, and put the largest shift element selector in to your browser’s developer console and see exactly which element it corresponds to:
> $("[Element selector here]")
CLS Analysis Flyouts
In addition to the attribution options, we also break down CLS by URL (or URL group).
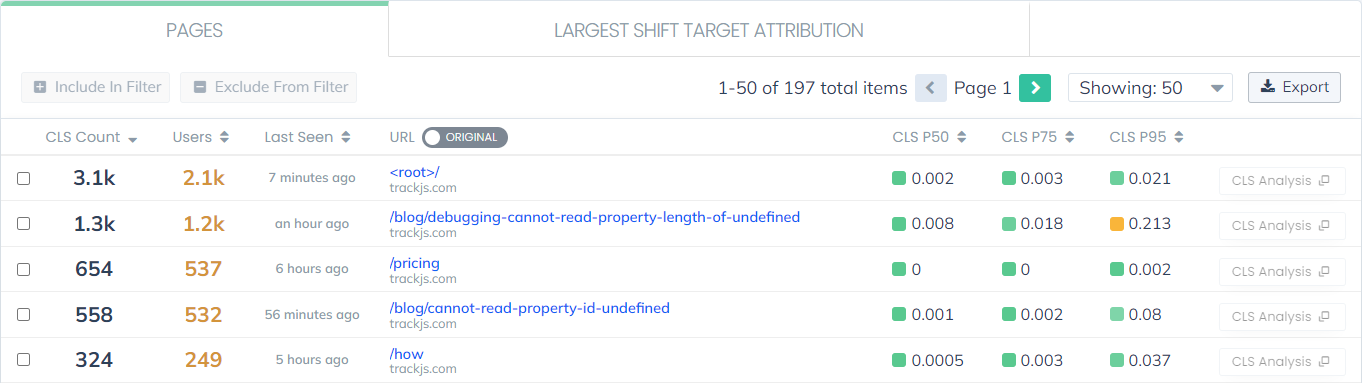
You can of course drill in to any URL you want to learn more about, but we also include a “CLS Analysis” button for each row in the table. If you click it, you’ll get fast facts about the CLS scores for that URL
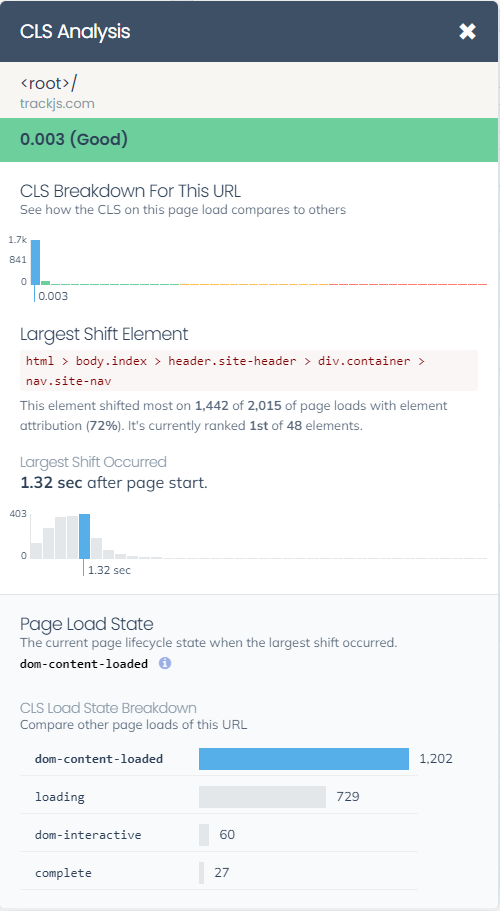
In addition to the largest shift element and CLS histogram, another important piece of data displayed is how long after page load did the layout shift start? This can help you diagnose the offending code or third party provider. As can the page lifecycle state when the shift occurred (better to have no layout shifts, but earlier in the page load lifecycle is probably better).