
Domain Forwarding
Domain forwarding allows the Request Metrics agent to communicate through your own domain. This often resolves situations where telemetry information is blocked by overzealous ad-blockers. Request Metrics appears on some privacy blocking lists despite the fact that we prevent the global identification of users.
Domain forwarding allows the Request Metrics agent to communicate through your own domain. This often resolves situations where telemetry information is blocked by overzealous ad-blockers. Request Metrics appears on some privacy blocking lists despite the fact that we prevent the global identification of users.
Optional: Try Bundling First
A simple first step is to bundle the agent script into your own code. Bundling prevents our script from being blocked before it runs and has page load performance benefits. However, some ad-blockers will still prevent the script from sending telemetry back to our servers!
Configure Domain Forwarding
To enable domain forwarding, you’ll need access to your DNS settings, the Request Metrics account and your code. Domain forwarding is configured per site. If you have multiple sites in your account, you will need to configure each site individually.
Pick a subdomain for Request Metrics to use. If your site’s main domain is example.com, then you would pick a subdomain like rm.example.com.
1. Configure Your Subdomain
Use your DNS provider to CNAME your subdomain to forwarder.requestmetrics.com.
TIP: DNS changes can take some time to propagate. Verify that the new subdomain is resolving before moving to the next step.
2. Configure Your Request Metrics Application
You must tell Request Metrics which subdomain your site is using. Select your site in the Request Metrics Dashboard then navigate to Settings -> Domain Forwarding.
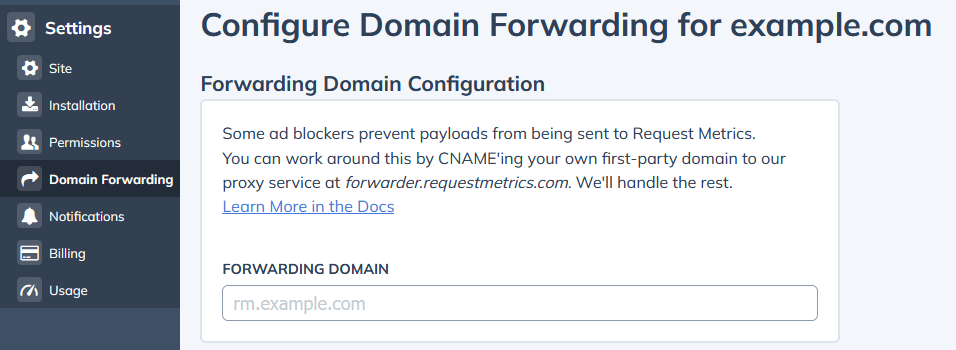
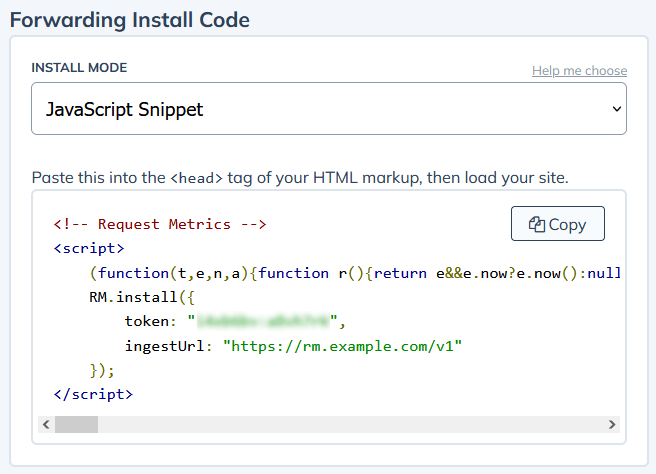
3. Update Your Code
The agent install code snippet needs to be updated. Replace your agent install snippet using the new snippet displayed in the Domain Forwarding settings UI:
4. Verify Changes
Ensure performance data from your site is still being captured to verify your new configuration. Reload a page on your site several times. In the Request Metrics dashboard ensure those page loads are visible when viewing data for the “Last 60 minutes” reporting period.
TIP: The Request Metrics dashboard displays close to real time data. It may take up to 30 seconds for new page views to display in the UI.