
Page Load
Page load speed is crucial because faster websites provide a better user experience, leading to higher engagement and lower bounce rates. It also impacts SEO, as search engines prioritize fast-loading pages, improving visibility and ranking.
Understanding and measuring load performance is the beginning of providing an optimal user experience.
Request Metrics measures the load performance (among other many other metrics) of every page on your site, giving you unparalleled ability to investigate performance problems and see how real users experience your site.
Demo Video
If you want the TLDR, here’s Eric going through the site showing a few of the ways you can monitor and investigate page load:
Page Load Visualizations
Percentiles Not Averages
When Request Metrics shows aggregate load performance, we show it using percentiles. Percentiles provide a clearer picture of user experience by highlighting the performance for the majority of users, whereas averages can be skewed by extreme outliers.
Here we can see the load performance percentiles that are present on many pages, including the overall page performance dashboard:
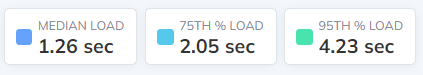
Displaying P50, P75, and P95 together provides a complete view of performance distribution, showing how median users experience your site compared to slower users, and helping identify specific areas where performance degrades for more users more often.
Load Histograms
We further break down page load performance in to 11 buckets, to make a colorful histogram. Useful visualizations are as important as capturing accurate data.
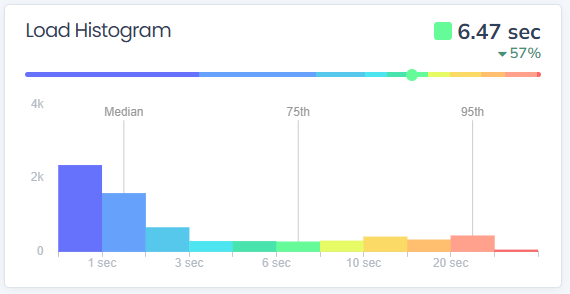
While the colors make the histogram look nice, they also serve an important purpose. It’s easy to find problem pages when viewing tables of performance data. Just look for the yellow, orange and red :)
The histogram also shows you the performance distribution your site (or a given URL). Ideally the tallest bars are towards the left. If you have a bimodal distribution or an even distribution it might be a sign that there is too much variability in your site’s performance.
Lifecycle Waterfall
Page load is a coarse metric. It’s useful, to be sure, but it doesn’t tell the whole story - and we aim to tell the whole story! To that end we also include a page lifecycle waterfall.
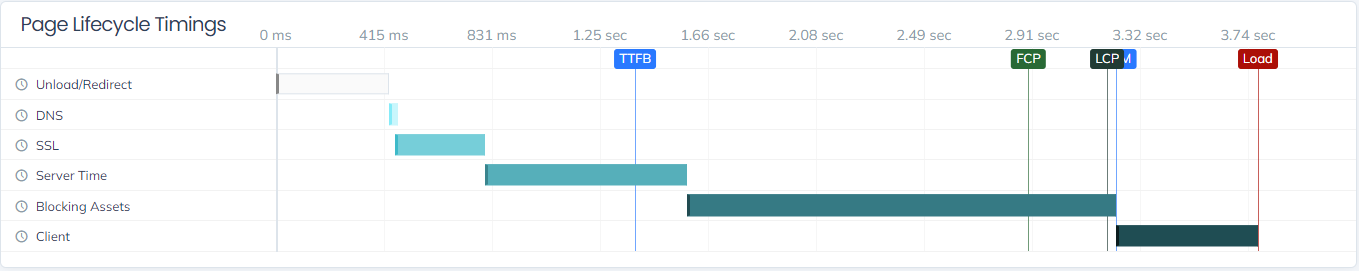
Page load is comprised of several discrete steps, starting with DNS resolution and SSL negotiation. How long the server takes to respond can impact the page load peformance just as much as slow loading JavaScript. So we show you the timing waterfall for all the relevant stages, helping you decide where to focus your investigation first.
In the example above, looking at the resources loading during the blocking asset phase (prior to DOMContentLoaded) would be a good place to start!
Load Over Time
Overall load aggregates are nice, but seeing your load performance over time can provide additional context. It can help when you’ve made improvements and want to see if they’re working too.
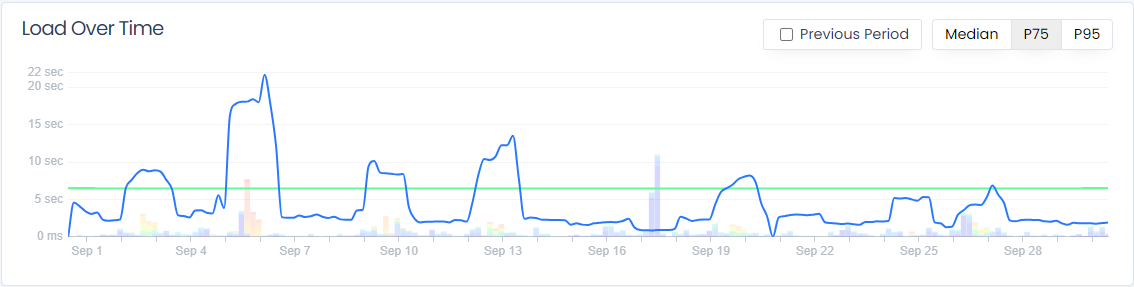
We put these load over time charts on many pages to make it obvious not only how your site is performing, but when is it performing that way. For example, in the chart above, we can see at a glance that there are some periods of very slow traffic and some periods of fast traffic. The P75 ends up being somewhere in the middle, but that single metric doesn’t tell the bimodal distrbution story.
Page Load by URL
If you haven’t had enough page load metrics yet, Request Metrics will also break your page load percentiles by many other facets. Perhaps the most useful and important is URL.
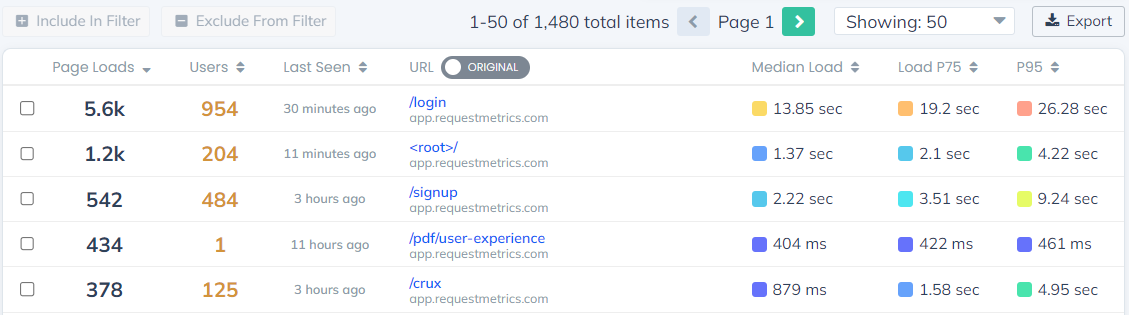
In the table above, the slow performance of the /login URL is immediately evident. You can further drill down to any URL (or user or browser or country) and learn more than you ever wanted to know. Want to see the individual page loads that are causing the problem? Coming right up.
Individual Pages
Once you’ve found a URL (or other facet) you want to investigate, you can drill in and see all the same aggregates from above - but scoped only to that URL. But, just as importantly, you can see all the individual page views that make up that metric too!
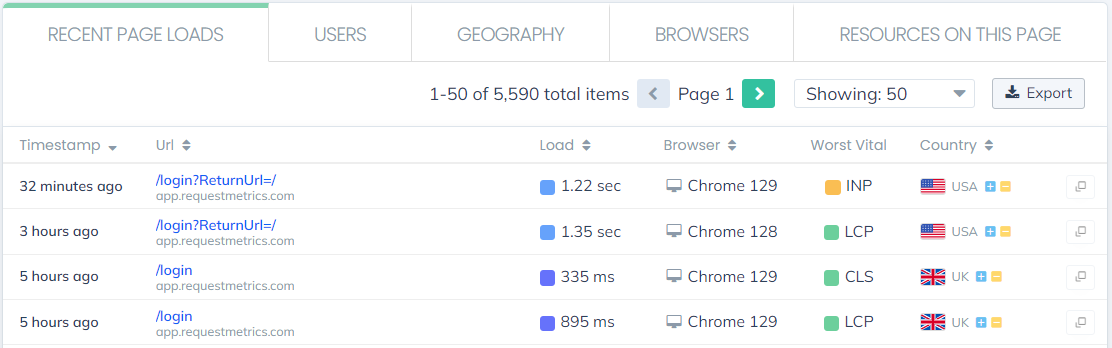
And of course, once you’ve found a page load you’re interested in investigating, you can go even deeper.
Resource Timeline
Request Metrics can show you all of the resources that make up a page load too. Just find one you want to look at and click in.
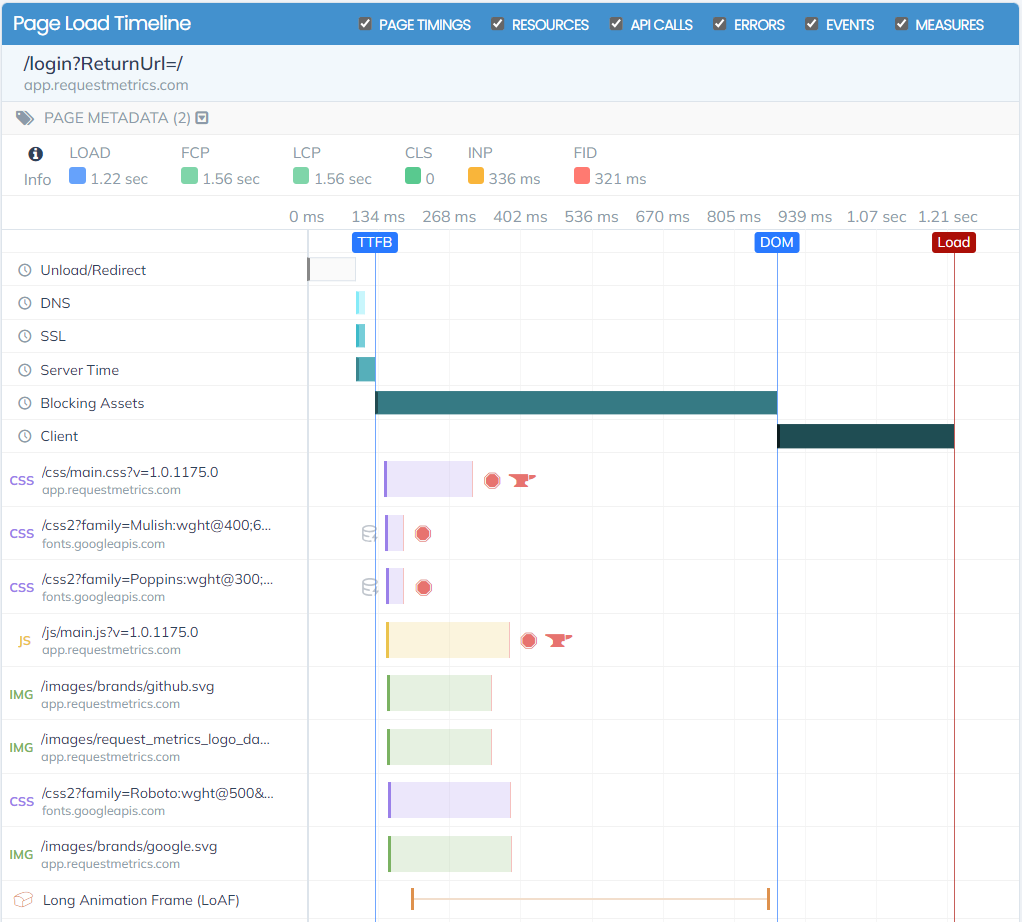
We’ll show you all the resources, plus custom marks and measures, and even long animation frames. It’s all arrayed in a glanceable timeline/waterfall format.
Even More Data
Request Metrics has the most comprehensive suite of performance data out there. And we let you filter, slice and dice to your heart’s content. If you want to answer a question, chances are we have the data to help you do it!