
Largest Contentful Paint (LCP)
Measuring Largest Contentful Paint (LCP) shows how quickly the main content of a page loads. It reflects user experience by tracking when the largest visible element renders. Optimizing LCP leads to faster load times, better user satisfaction, and improved search rankings.
This guide is about how to use Request Metrics to solve LCP problems.
If you just want to learn more about Largest Contentful Paint we’ve got you covered there too.
Request Metrics measures everything about Largest Contentful Paint - from timing to which elements and images caused it. From render delay to element load delay.
Demo Video
Here’s a quick look at Eric navigating through the UI exploring LCP for requestmetrics.com
Largest Contentful Paint Timing
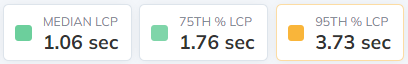
Percentiles and Histograms
As with page load, we show multiple percentiles when displaying LCP timings. Percentiles are a more reliable indicator than averages, since we can remove the outliers from impacting the data too much.
We also include histograms showing the Largest Contentful Paint breakdown across your visitors.
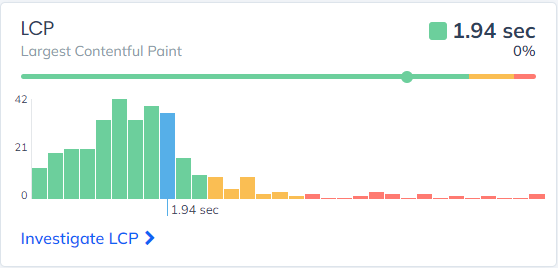
This way you can get a sense for how your LCP is distributed. Multimodal distributions can suggest problem areas that require further investigation.
LCP Over Time
We also monitor LCP over time. Naturally the idea is to improve the timings, but it’s always good to know there hasn’t been a regression as well!
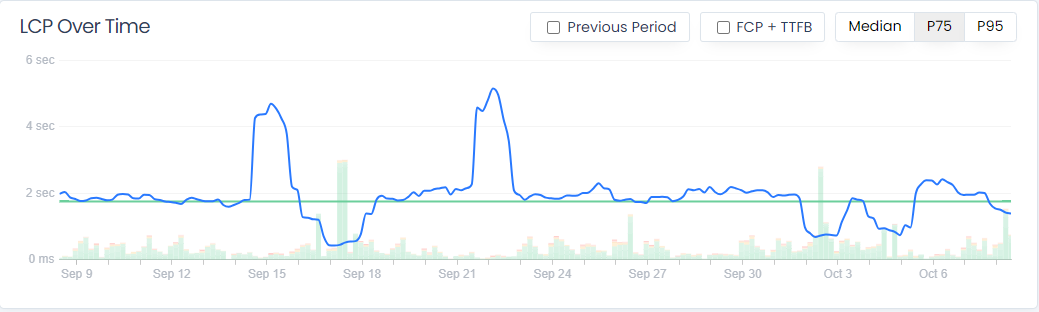
We can see for this particular set of page loads the LCP is mostly stable but we do get the occasional blip - maybe something to investigate?
LCP Attribution
Knowing your site has a slow LCP is important. “Knowing is half the battle,” and all that. But the other half of the battle is just as important - attribution! Said another way - what things are causing the LCP to be slow?
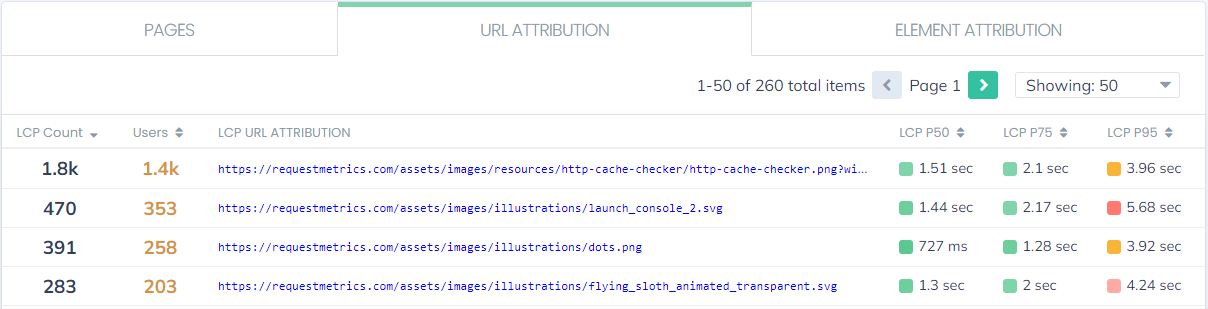
URL Attribution
Request Metrics includes two kinds of attribution for Largest Contentful Paint. The first is which URL was responsible for the LCP on that page load. The URL is almost always an image, but it can be other things too. We let you slice and dice the URL attribution data however you want - but at a basic level it can be interesting to look at the top URL contributors to LCP.
Element Attribution
The other kind of attribution we offer is called “Element attribution”. This is a CSS selector that describes the element that caused the LCP. Oftentimes this has a 1:1 match with a URL. However, in the case of single-page applications, it’s not uncommon to have only an element causing the LCP when a large part of the site re-renders.
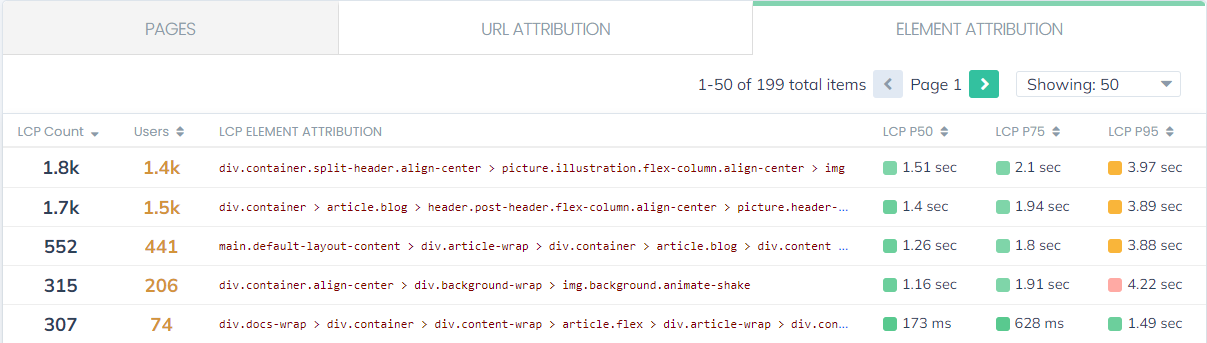
The fun thing with element attribution is you can literally put that selector in to your browser’s developer console and see the element spit out:
> $("[Element selector here]")
LCP Analysis Flyouts
In addition to the attribution options, we also break down LCP by URL (or URL group).
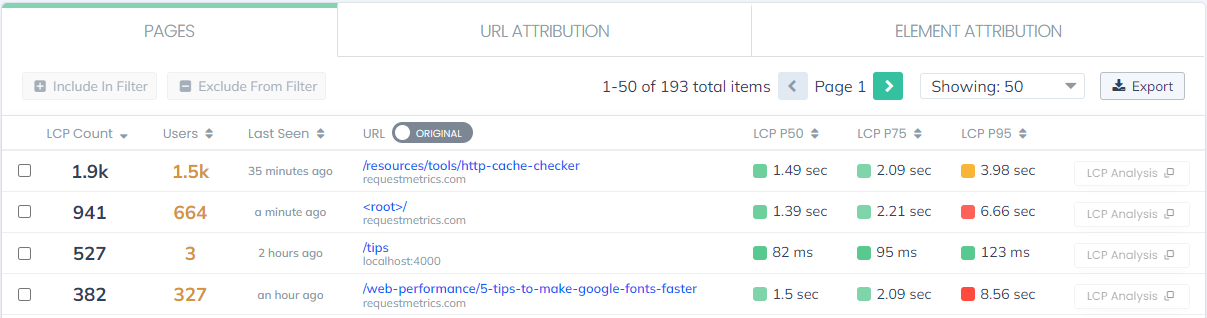
You can of course drill in to any URL you want to learn more about, but we also include an “LCP Analysis” button for each row in the table. If you click it, you’ll get fast facts about the LCP for that URL
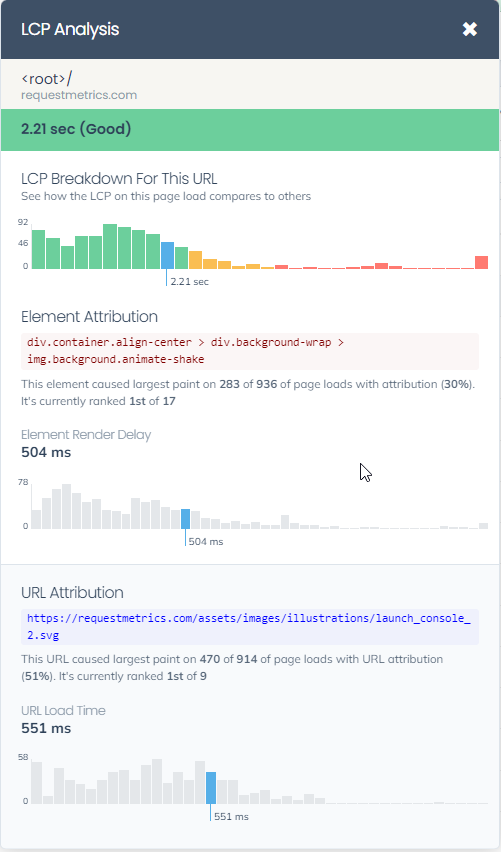
There’s lots of granular data in here - from how long the URL usually takes to load, to the element render delay. Go wild.
Individual Page LCP
As with other values, in Request Metrics you can go as deep as you want. All the way to the individual page view. If you find a URL, element or page you’re interested in exploring, you can find all the individual page views that go with it.
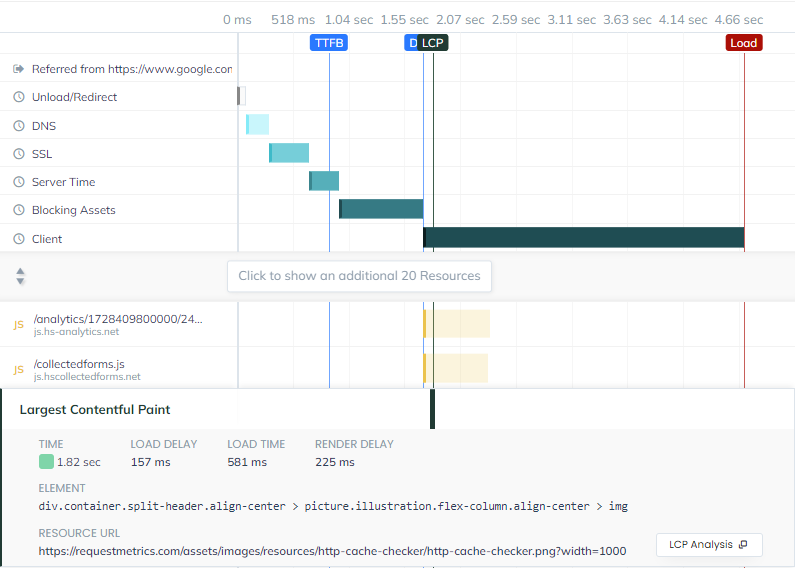
Once you’ve navigated to an individual page view, the Largest Contentful Paint pane will be expanded, and preceding resources/events/errors collapsed. You can easily expand the other items or simply focus on the individual LCP event. There’s a handy analysis flyout available here too.