

Measuring Cumulative Layout Shift (CLS)
Cumulative Layout Shift (CLS), sometimes known as jank, is a measurement of how much elements move due to late-rendered content. You can think of it as a measurement of layout instability. It has become a common problem for many websites due to third-party scripts and tag management and its one of the new Core Web Vital metrics.
Layout Instability
Modern web applications are complicated. JavaScript renders the DOM, third party scripts are added like candy, and too many cooks are in the kitchen rendering DOM content asynchronously (ad networks, A/B test tools etc). This complexity and asynchronous loading are responsible for a major problem: layout instability.
Layout instability occurs when DOM elements shift around due to dynamically rendered content. Here’s an example anyone who’s ever used the mobile web can relate to:
The DOM elements are shifting around in response to new content rendering and it’s making it difficult for the user to complete the action. In this example it’s particularly jarring but any amount of layout shift is bad for user experience. How can we determine whether the sites we’re building suffer from layout instability?
Layout Instability Measurement API
The folks at the Web Incubator Community Group (WICG) have proposed an API to help measure layout instability (also called “layout shift”). It’s only supported in Blink-based browsers at the moment, such as Chrome, Edge, and Opera, but it’s fairly straightforward to use. The goal is to provide a quantitative way to measure layout shift consistently.
Let’s try out the API on the example above where the ads pop in. The first thing to do is create a PerformanceObserver object. Then we need to tell it the kind of entries we want to watch for. Note that we also pass it the buffered: true option which will include all entries that occurred before we ran our code.
new PerformanceObserver(entryList => {
    console.log(entryList.getEntries());
}).observe({ type: "layout-shift", buffered: true });
Note that we’re using the PerformanceObserver class instead of the performance object. Today, performance.getEntries() does not include the LayoutShift entry.
This code gives the following console output for our contrived advertising example:

We can see that there were two layout shifts, each corresponding to a new ad that pops in. Pay special attention to the value property. This is the “score” describing the magnitude of the layout shift. The higher the score, the more jarring the shift. The score is a combination of the impact fraction and the distance fraction. The two values are multiplied together to compute the value of the layout-shift entry. The WICG API document goes in to detail on how the score is calculated. Suffice it to say, we want to keep our scores low!
Cumulative Layout Shift
As the browser renders a web page and content renders asynchronously, there can be many layout shifts. In the example above there were two shifts as the ads popped in, but on many sites there are half a dozen or more layout shifts before the page is loaded. In order to talk about layout instability consistently, we need to sum these layout shifts to arrive at a singular metric. This metric is called Cumulative Layout Shift.
Google has created a helpful page describing Cumulative Layout Shift (CLS) and what it means. CLS is one of the three major “Core Web Vitals” that Google recommends measuring to ensure your users are having a good experience. Google will rank search results based on these scores someday soon, so it’s important to understand how our websites perform.
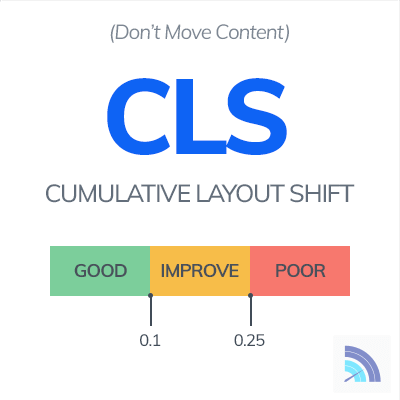
According to Google, your CLS should be below 0.1 to be considered “good”. Anything above and you’re moving too much content asynchronously.
Measuring CLS with JavaScript
We can improve upon our code snippet in a few ways to measure the cumulative layout shift. You might think we can just add up the value of each layout shift entry and call it a day, but it’s not quite that simple. Not all layout shifts are bad or unexpected. If a user clicks a button or link, it’s reasonable to expect the layout to change in some fashion. We don’t want to include expected layout shifts in our calculation, only unexpected.
To do that we can use another property on the layout shift entry: hadRecentInput. This property will be true if the layout shift was likely caused by user input. Let’s update our snippet to exclude any layout shifts that came from recent user input, and then sum the remaining items to get the final CLS score for the site:
new PerformanceObserver(entryList => {
    var entries = entryList.getEntries() || [];
    var cls = 0;
    entries.forEach(e => {
        if (!e.hadRecentInput) { // omit entries likely caused by user input
            cls += e.value;
        }
    });
    console.log(`Cumulative Layout Shift: ${cls}`);
}).observe({ type: "layout-shift", buffered: true })
Now that we’ve put it all together, let’s look at the CLS scores for some popular websites when loaded in Chrome Devtools with mobile device emulation turned on.
- Google.com:
0 - Youtube.com:
0.049 - CNN.com:
0.2898 - Chase.com:
1.7163
None of these results are terribly surprising. The two worst performers both have heavy sites with lots of JavaScript rendered content (and in the case of CNN, a gratuitous amount of third party ad providers). Google on the other hand prides itself on performance and it would be hypocritical if they didn’t do well with their own important metrics.
Limitations of CLS Scoring
The CLS score for a site is somewhat non-deterministic. In cases where many asynchronous resources are loaded and rendered, the CLS will change based on the arrival and execution time of those assets. Users with slower internet connections or computers will likely experience higher CLS as there will be more layout changes necessary to accommodate async resources. (The browser can batch layout shifts between animation frames if the resources are all present at once)
Additionally, the CLS score is heavily influenced by viewport size. The CLS will often be higher for mobile users because their viewports are smaller and any movement is larger as a percentage. Whether this makes sense in all cases is debatable - if a user has trouble clicking a button or link due to async DOM rendering, they are going to be irritated whether it’s desktop or mobile.
While CLS is an imperfect metric, it is still a valuable signal for the user experience of your site. Users that can’t read content or click buttons because the page keeps moving around will be irritated.
Looking for more? Check out the Definitive Guide to Measuring Web Performance.

