Measuring Web Performance in 2024: The Definitive Guide
This is the complete guide to the metrics, methods, and measurements of web performance in 2023.
If you run a website, this guide has all the fundamental ideas you need to understand to build a fast website for your users, and for search engines.
Contents
-
 Chapter 1Web Performance Fundamentals
 -
 Chapter 2Web Performance Metrics
 -
 Chapter 3Kinds of Web Performance Data
 -
 Chapter 4Common Web Performance Tools
Chapter 1:
Web Performance Fundamentals
In this first chapter, we'll start with the basics of web performance, what it is, and why you need to care about it.
You'll see why web performance has never been more important. Let's go!
What is Web Performance?
Web performance is about how fast your website feels to your users. A slow website causes frustration by slowing down the user doing their work. These user feelings are sometimes called Perceived Performance.
Feelings are difficult to measure. Each person can have a different expectation for how fast a website should be, based on what the user is doing and the kind of website. Users probably won’t wait 6 seconds for a click-bait story, but will wait 10 seconds or longer for Gmail to start.
Simon Hearne shared that in the psychology work in “The Psychology of Waiting Lines”, David Maister defines 6 laws that people tend to follow when waiting in line, or waiting for a website:
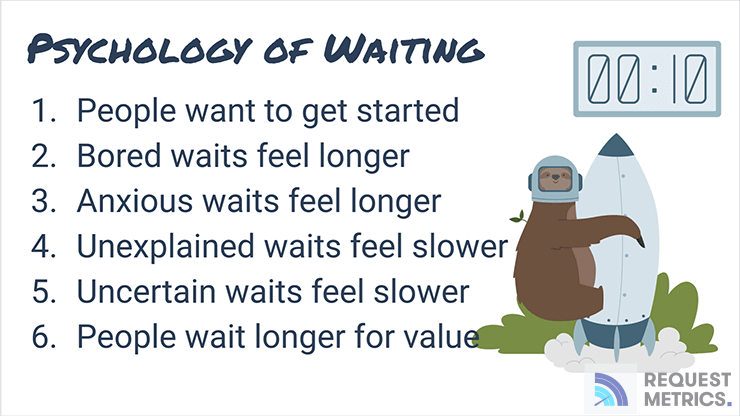
1. People want to get started
You’re excited about an idea, or you’ve finally overcome procrastination to start. When you open up a web application to begin your work, you don’t want to wait for it. Slowness seems slower when you’re eager to get started with your work.
2. Bored waits feel longer
You’re sitting in the back seat on a long road trip. Back in the days before cellphones and handheld games. All there was to do was stare out the window. That trip took forever. It felt longer than it was because you were so bored.
Same with a website. When you’re avoiding your work and scrolling through Twitter, if a link is slow to load, you lose interest real fast.
3. Anxious waits feel longer
When you are nervous about the content of a page or the results of a request, delays feel longer than they are. Imagine waiting for a medical test result to load, or see the status of a mortgage application. Watching the loading spinners feels slow because of the importance of the result.
4. Unexplained waits feel slower
You’ve probably bought lots of things on the internet, and you know how it works. So when you visit an online store and add a product to your cart, you have an expectation of how long it should take. But as the seconds tick by, it feels wrong. You didn’t expect to have to wait here, and you start second-guessing if you really need that new graphic t-shirt.
5. Uncertain wait times feel slower
You submit a form and see a loading spinner with the text, “please wait”. Wait? How long? As the seconds pass, you think that maybe the form failed and needs to be resubmitted. You may even decide to abandon and try something else. When the user doesn’t understand how long they will wait, the wait time feels exaggerated.
6. People wait longer for value
When you click on that hot celebrity gossip link at TMZ, you’ll wait 4 or 5 seconds for it to load. But if it’s not ready, you’ll probably lose interest and move on. You should probably get to work.
So you open your work GMail account. GMail is a big webapp, and sometimes it takes 6 seconds or longer to load. But you’ll wait for it, because it’s important.
Why is Web Performance Important?
You’ve probably seen the case studies. Lots of eCommerce sites, marketing sites, and software services have shown a correlation between performance improvements and the success of their website.
Slow web pages frustrate users and make them less likely to stick around. Less likely to buy that thing, click on your link, or subscribe to your service. Google can see this in search behavior–people are less likely to stay on slow sites.
Why Does Google Care About My Performance?
Google wants search results to be as relevant and useful as possible–slow sites are not very usable. Search users are more likely to bounce off a slow search result than a fast one.
Performance is such a strong signal to Google that website performance is considered part of a website’s search ranking. So if for no other reason, make sure your site is fast so you don’t lose ranking to your competitors that do.
How does Google measure your website performance? The next chapter covers all the metrics.
Chapter 2:
Web Performance Metrics
Now that you know why your website needs to be fast, you need to know how to go about measuring it.
This chapter will show you the common metrics used to measure website performance and what they are measuring.
Page Load Time
In the beginning, there was PageLoad. Website performance was measured with a single measurement of the time until the PageLoad event is fired.
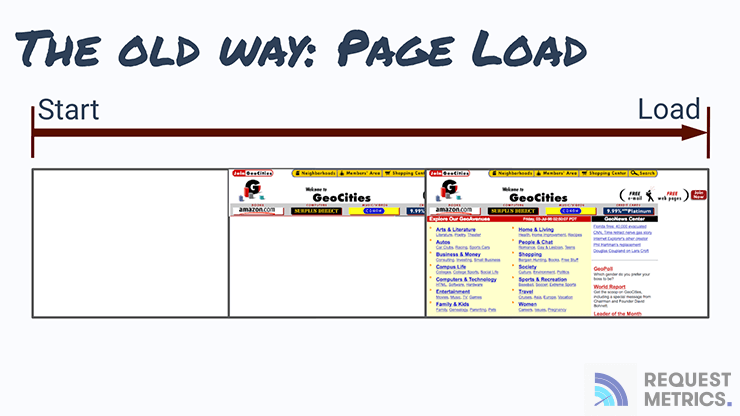
But PageLoad doesn’t fully describe performance. Some sites initially load really fast, but dynamic content needs to load. PageLoad doesn’t fully capture whether a website feels fast.
Worse, PageLoad was easy to manipulate. Developers could improve their PageLoad time by deferring work with JavaScript. Lazy-loading, async script loaders, client-side rendering, and dynamic content were all patterns that often improved PageLoad time, but created a slower experience from the end user perspective.
What do we do instead?
There are lots of ways a website can feel slow: slow to start, slow to finish, jumping around, slow to respond, and more. We can’t use one metric to understand performance anymore.
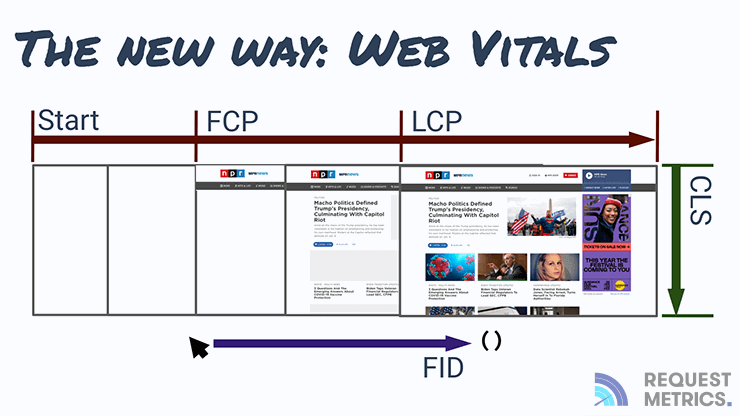
The Core Web Vitals
In 2019, Google introduced a set of metrics intent on measuring the actual performance of a website as the users would see it. These metrics are collectively called the Core Web Vitals.
They are measured in all Chrome-based browsers, including the Googlebot spider, which uses these scores to influence page rank.
Note that Chrome-based browsers, Firefox, and Safari support these metrics and compatibility is increasing. You can check the current compatibility of the Core Web Vitals here.
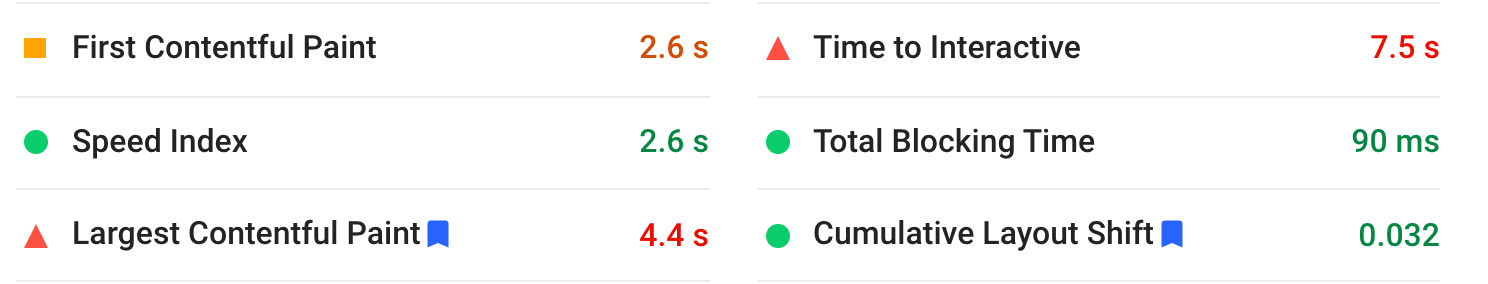
First Contentful Paint (FCP)
“First Contentful Paint” measures how long it takes to show the user that the request has been received and the page will load. For example, when you click on a news story, FCP measures the time from the click until the NPR News header renders.
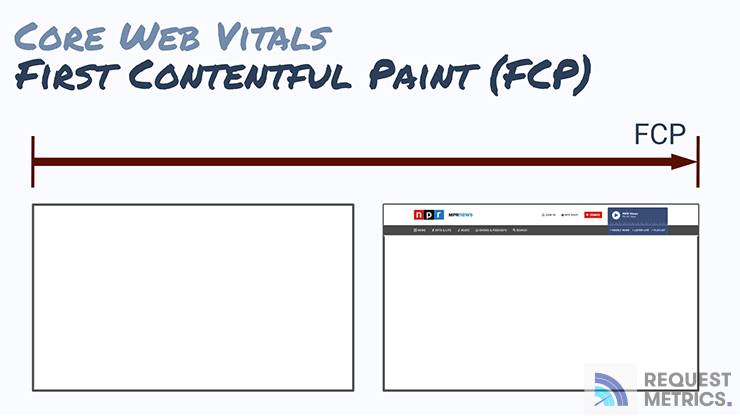
FCP encourages websites to respond quickly to requests. Learn more about First Contentful Paint and how to measure it.
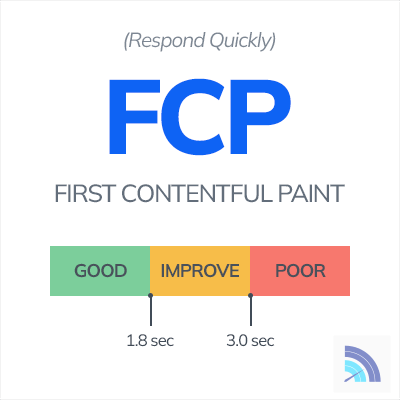
Google recommends that your FCP should be less than 1.8 seconds. Scores of greater than 3.0 seconds are notably poor and are likely to have a problem.
Largest Contentful Paint (LCP)
“Largest Contentful Paint” measures how long it takes until the browser renders the largest amount of content to the screen. At this point, ideally, the user can see the content they are looking for and believes the page is nearly done.
It would be more accurate if you measured the time until the most important content was visible, but that’s difficult to do programmatically. LCP is a proxy measurement for most important content.
An example, navigating to the homepage of NPR News has a few different renders, but this is the largest one by pixel area:
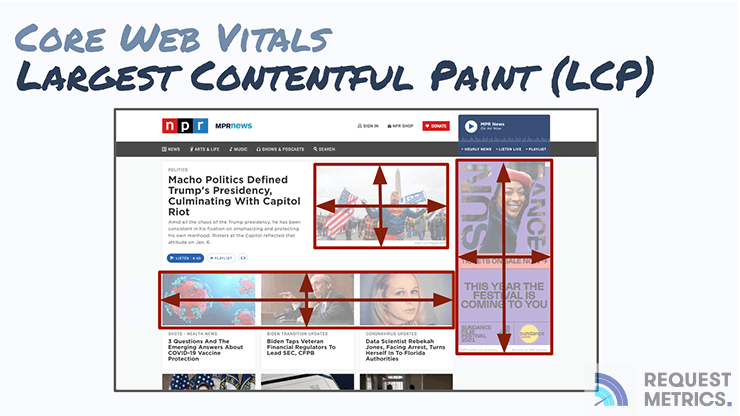
The advertisement is probably not what the user is looking for, but the article images might be.
LCP encourages websites to finish quickly by emphasizing their primary content and making sure it loads fast. Learn more about Largest Contentful Paint and how to measure it.
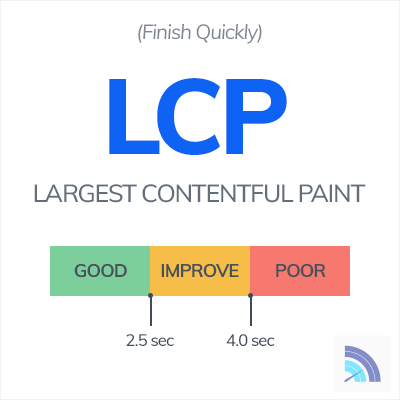
Google recommends that your LCP should be less than 2.5 seconds. Scores of greater than 4.0 seconds are notably poor and are likely to have a problem.
Cumulative Layout Shift (CLS)
“Cumulative Layout Shift” is a little harder to understand because it does not measure time. CLS measures how much the content on a page moves around as other content is loaded and rendered. Like this:
Layout Shifts measure how late-rendered content affects the user experience of a page. Layout shifts that push important content around are really frustrating to use.
CLS discourages websites from moving content around once the user sees it and minimizing the amount of late-rendered content. Learn more about Cumulative Layout Shift and how to measure it.
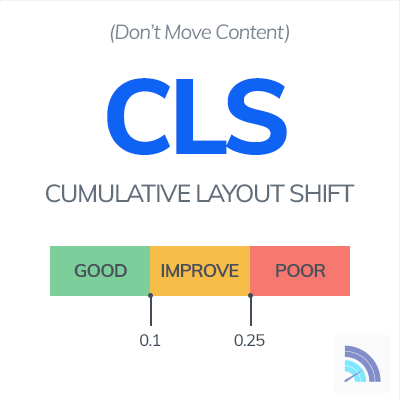
Your CLS score should be less than 0.1 and no worse than 0.25.
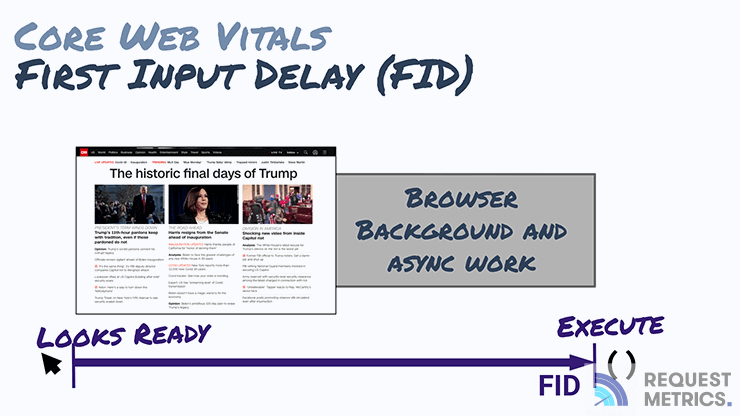
First Input Delay (FID)
“First Input Delay” measures whether the page is really done when the user thinks it’s done. If the browser is busy downloading, parsing, and running JavaScript when the user clicks on the page, there will be a delay until the browser can handle the event and trigger the click event. FID measures this delay.
FID discourages websites from loading too much JavaScript before the user begins interacting with the page. Learn more about First Input Delay and how to measure it.
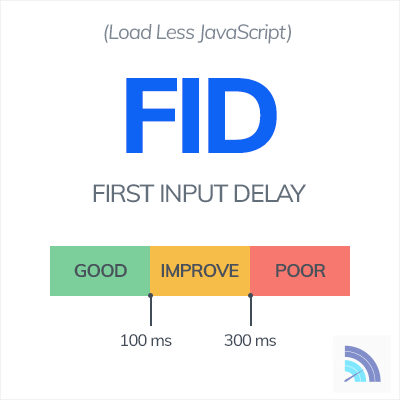
Interaction delays are easily noticeable by most people, so you shouldn’t tolerate much delay here. Less than 100 ms ideally, and definitely no worse than 300 ms.
Other Common Performance Metrics
Aside from the Core Web Vitals, there are several other metrics that are commonly used by popular performance tools.
Time to First Byte (TTFB)
Time to First Byte measures the time until your server returns it’s first byte of data. This represents both the network latency of your users as well as the processing time your server requires to assemble the document.
TTFB is a subset of the First Contentful Paint metric, which is also measuring the document size, parse, and render time.
Time to Interactive (TTI)
Time to Interactive is a measurement from Chrome Lighthouse that measures the time required until a page is fully interactive, including painted, JavaScript completed, and the browser is done with its background tasks.
TTI includes both the Largest Contentful Paint, the First Input Delay, as well as other background processing timers.
Google recommends a TTI of less than 5 seconds to be considered fast. Sites slower than 7.3 seconds have serious performance concerns. Note that this is a wider range than LCP.
Total Blocking Time (TBT)
Total Blocking Time is the time where user input is delayed due to browser background tasks, such as JavaScript processing or parsing CSS. It measures how busy the browser needs to be in order to load your webpage.
Speed Index
Speed Index is a popular metric used by WebPageTest and Google performance tools that measures the visible changes while a webpage is loading to determine when the user believes that the webpage is done loading.
Now that you know the web performance metrics, what they measure, and what a good scores are, you need to understand the ways to gather these metrics. We’ll cover that in the next chapter. Read on!
Chapter 3:
Kinds of Web Performance Data
There are different ways to measure web performance, which test different things and have different results.
Before you jump into performance tools, you need to understand what kind of performance it is measuring.
Lab Data and Field Data
There are two types of web performance data: lab data and field data.
Lab performance data is gathered with a controlled test, such as a Lighthouse report. Lab data describes a single webpage load from a specified location on the network.
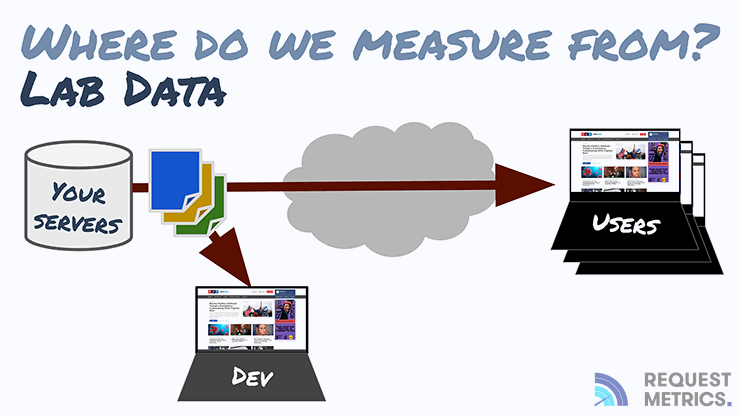
This kind of data is often called “Synthetic Testing” because it measures performance from a known device connected to the network. It does not measure the actual performance of any user, but an estimate for what performance will be.
Field performance data is gathered directly from the users of the website using a performance agent. Because field data includes data for each website user, there is much more data to filter and consider.
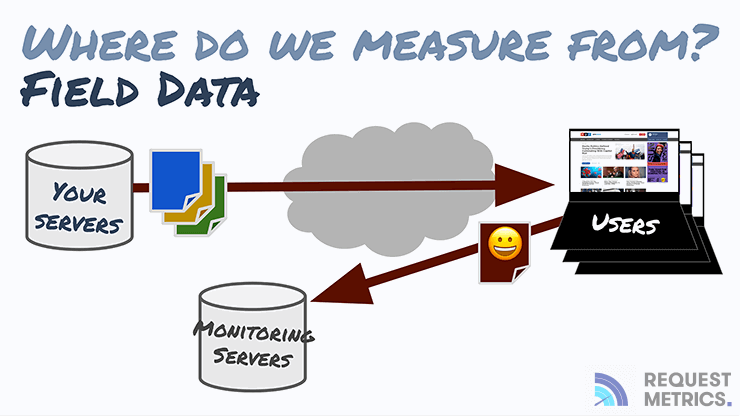
Field data is often called “Real User Monitoring” because it describes the actual performance experienced by users from a running website.
Field data can produce a lot of data, and not all of it is relevant. To understand field data, you’ll get to use statistics! Don’t worry, it’s not so bad.
Interpreting Performance Data with Statistics
The easiest way to understand sets of data is with averages. But averages aren’t great because they are often misleading because of unusual performance distribution.
Look at an example. An average Lighthouse score of 80 can come from either of these situations:
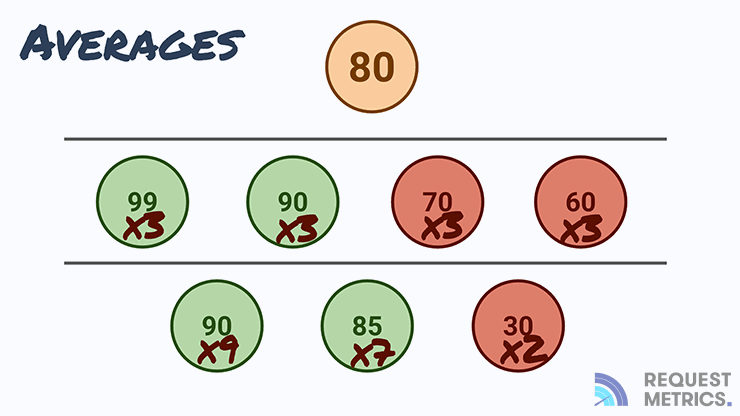
These tell very different stories. The top scores describe a site that has poor performance for half of its users and probably has an issue. The bottom score is being dragged down from a single outlier, and is probably doing okay.
So what can we do instead?
Median and Percentiles
Imagine if all your performance scores were sorted from best to worse. Your median performance is the value where half of your users had a faster experience. It’s a good proxy for your typical user and how they experience your website.
Median can also be called the 50th Percentile or p50 because 50% of your users will have a better score.
Performance numbers are often measured by their p50, p75, and p95 scores. Or, the performance experience for “typical users”, “most users”, and “worst users”.
Some code might help. The Lighthouse score of 10 tests is stored in an array. You can get the percentiles like this:
// Performance scores, sorted.
var lighthouseScores = [100, 100, 90, 90, 90, 80, 70, 70, 60, 50];

// Desired percentile to calculate.
var percentile = 0.75;

// Find the index 75% into the array.
var idx = Math.round( (lighthouseScores.length - 1) * percentile );

var p75Score = lighthouseScores[idx];
Or you might have your data in a spreadsheet, where you can use the PERCENTILE function.
Ok, enough background. On to the tools!
Chapter 4:
Common Web Performance Tools
Now that you understand the metrics and the methods of measuring web performance, it's time to look at the tools!
How do you know what tool to use, what it measures, and how accurate the data is? This chapter will help.
These are some of the best web performance tools available. Each measures your website performance in different ways from different places. These measurements will not always line up, but by understanding what each tool is testing, you will get a more complete picture of how your website performs.
1. Google Lighthouse
Lighthouse is an open-source tool from Google that can be run from Chrome DevTools or from the command line.
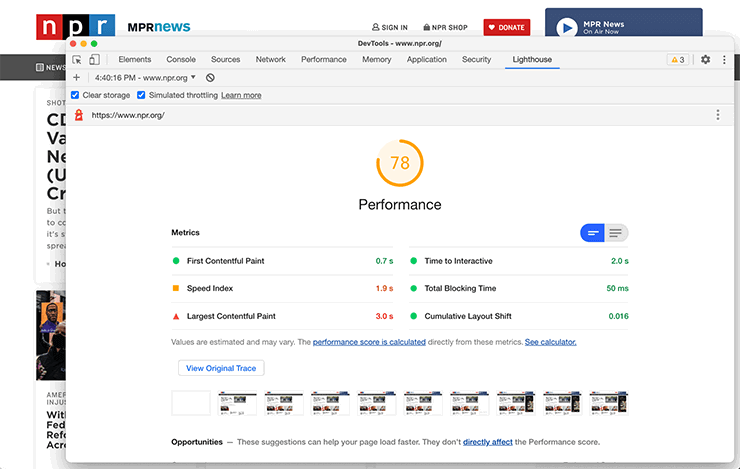
It’s run from you local computer, so it’s measuring the performance you experience with your hardware on your network. There are several places where you can run Lighthouse-as-a-Service from elsewhere on the internet, including Google’s PageSpeed Insights. However these services have mixed results depending on the structure, location, and capacity of the service.
Lighthouse is most useful for development-time testing of your site or performing audits on sites where you don’t have direct access (like snooping on what other websites are doing). Read more about the limitations of Lighthouse.
2. WebPageTest
WebPageTest is a free hosted service that performs performance tests on public websites. It can do a lot more things than Lighthouse, like setting up network locations, network speeds, and customizing requests.
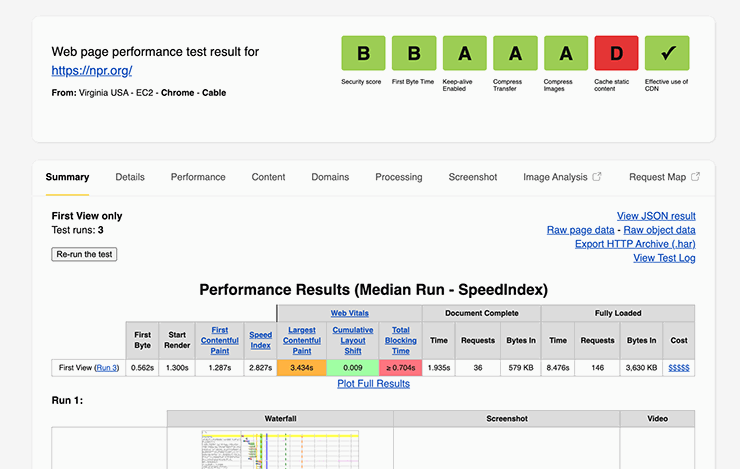
It also produces a more detailed (and more complex) report with network location, breakdown of timings, and a detailed waterfall chart.
WebPageTest is great for auditing live websites to better understand how they are performing in production.
3. Google Search Console
Google Search Console shows the analytics, issues, and performance recorded by the Googlebot crawler when Google indexes your website. This includes User Experience metrics like the Core Web Vitals.
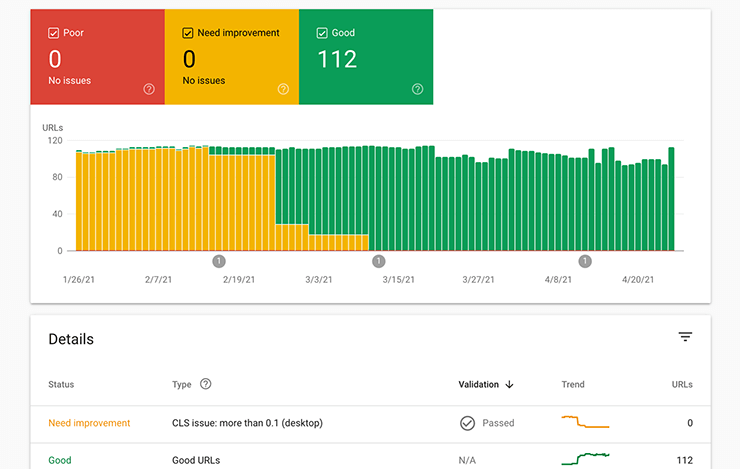
Although the Search Console metrics are synthetic, they are what Google will use to rank your site in search results. They represent a very important user: Google.
The metrics you’ll see in Search Console will be quite slow to update, depending on the traffic to your website. It could be a week or more for Google to see changes in your performance scores, and the reports are very generic.
You need to use Search Console to see how Google ranks your performance, but it’s not very useful for testing or discovering performance issues.
4. Chrome User Experience Report (CrUX)
The Chrome browser itself collects performance metrics from opt-in users for the top million domains on the internet. Google publishes these metrics in the Chrome User Experience Report or CrUX. It’s real-user data!
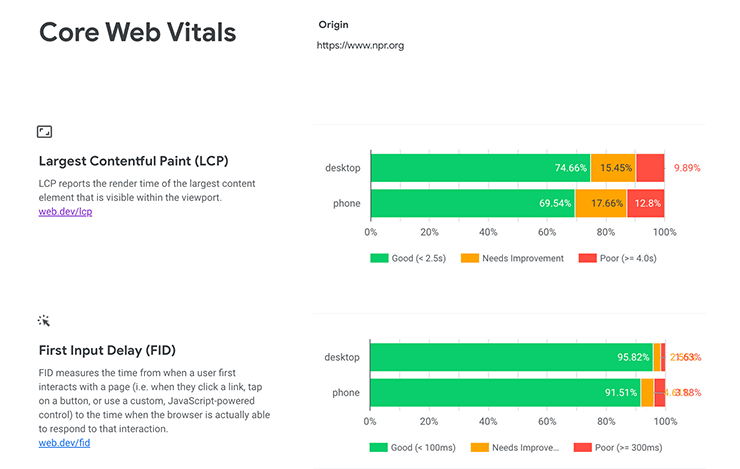
The data is really interesting, but it’s only published monthly and summarized to an entire domain. CrUX data is only accessible through BigQuery and DataStudio, Google’s Data Warehouse tools. If you haven’t used those tools before (like most people), it can be difficult to get meaningful information.
CrUX data is useful to see historical website performance, or compare your performance to other websites, but only if your website is large enough to qualify for inclusion.
5. Request Metrics
Request Metrics is a real-user analytics and observability service. Unlike CrUX, Request Metrics shows you how your site is performing right now with no delay in the data.
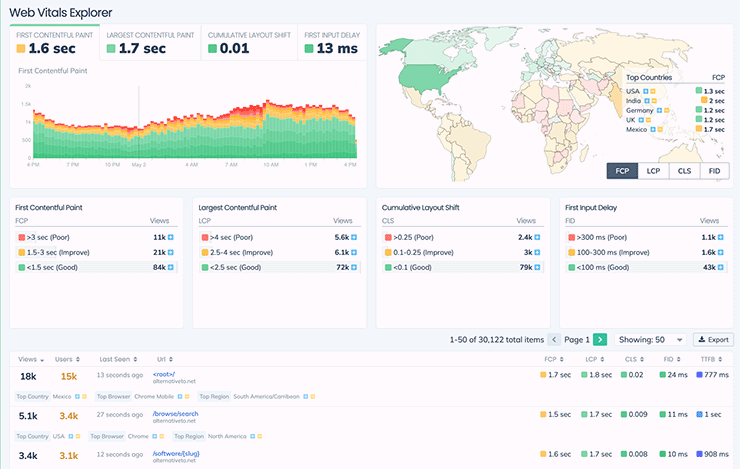
The charts are useful and easy to understand. The tool breaks down the large amount of data and gives you meaningful median, p75, and p95 metrics as well as some details on the causes of slowness.
Request Metrics is best for active monitoring of your website performance. It is really helpful when you are making performance changes to see how your improvements impact real users.
Conclusion
That's everything you need to know to start measuring web performance and making your website faster!
Which performance metric is most meaningful to you? Let us know on Twitter!