
Web Performance Profiling: Nike.com
Google has long used website performance as a ranking criteria for search results. Despite the importance of page experience for SEO, many sites still suffer unacceptable load times. Poor performance is often a confluence of factors: slow time to first byte, hundreds of resource requests, and way too much JavaScript.
Nike.com Is Slow
Let’s look at a popular online retailer: Nike.com. With outdoor exercise increasing in popularity post-COVID, Nike’s running shoe offerings are compelling (arguably too compelling) and we want to buy some.
But the experience on mobile when we navigate to a product details page for a VaporFly shoe is slow and janky.

There’s a few obvious problems:
- The page takes a long time to load. Subjective to be sure, but it’s over 5 seconds.
- There are multiple asynchronous parts rendering at different times causing contentful paint events. (The free shipping banner, the “Sign in to Buy” button etc.)
- There are several layout shifts occurring making the page load look janky. Particularly jarring is the product image rendering below the title and then jumping above it.
We can see that the page “feels” slow, but can we quantify it? Can we determine which specific pieces are responsible for the slowness?
Performance Auditing with Chrome
Chrome has great performance diagnostic tools. We’ll start on the Network tab of the developer tools.
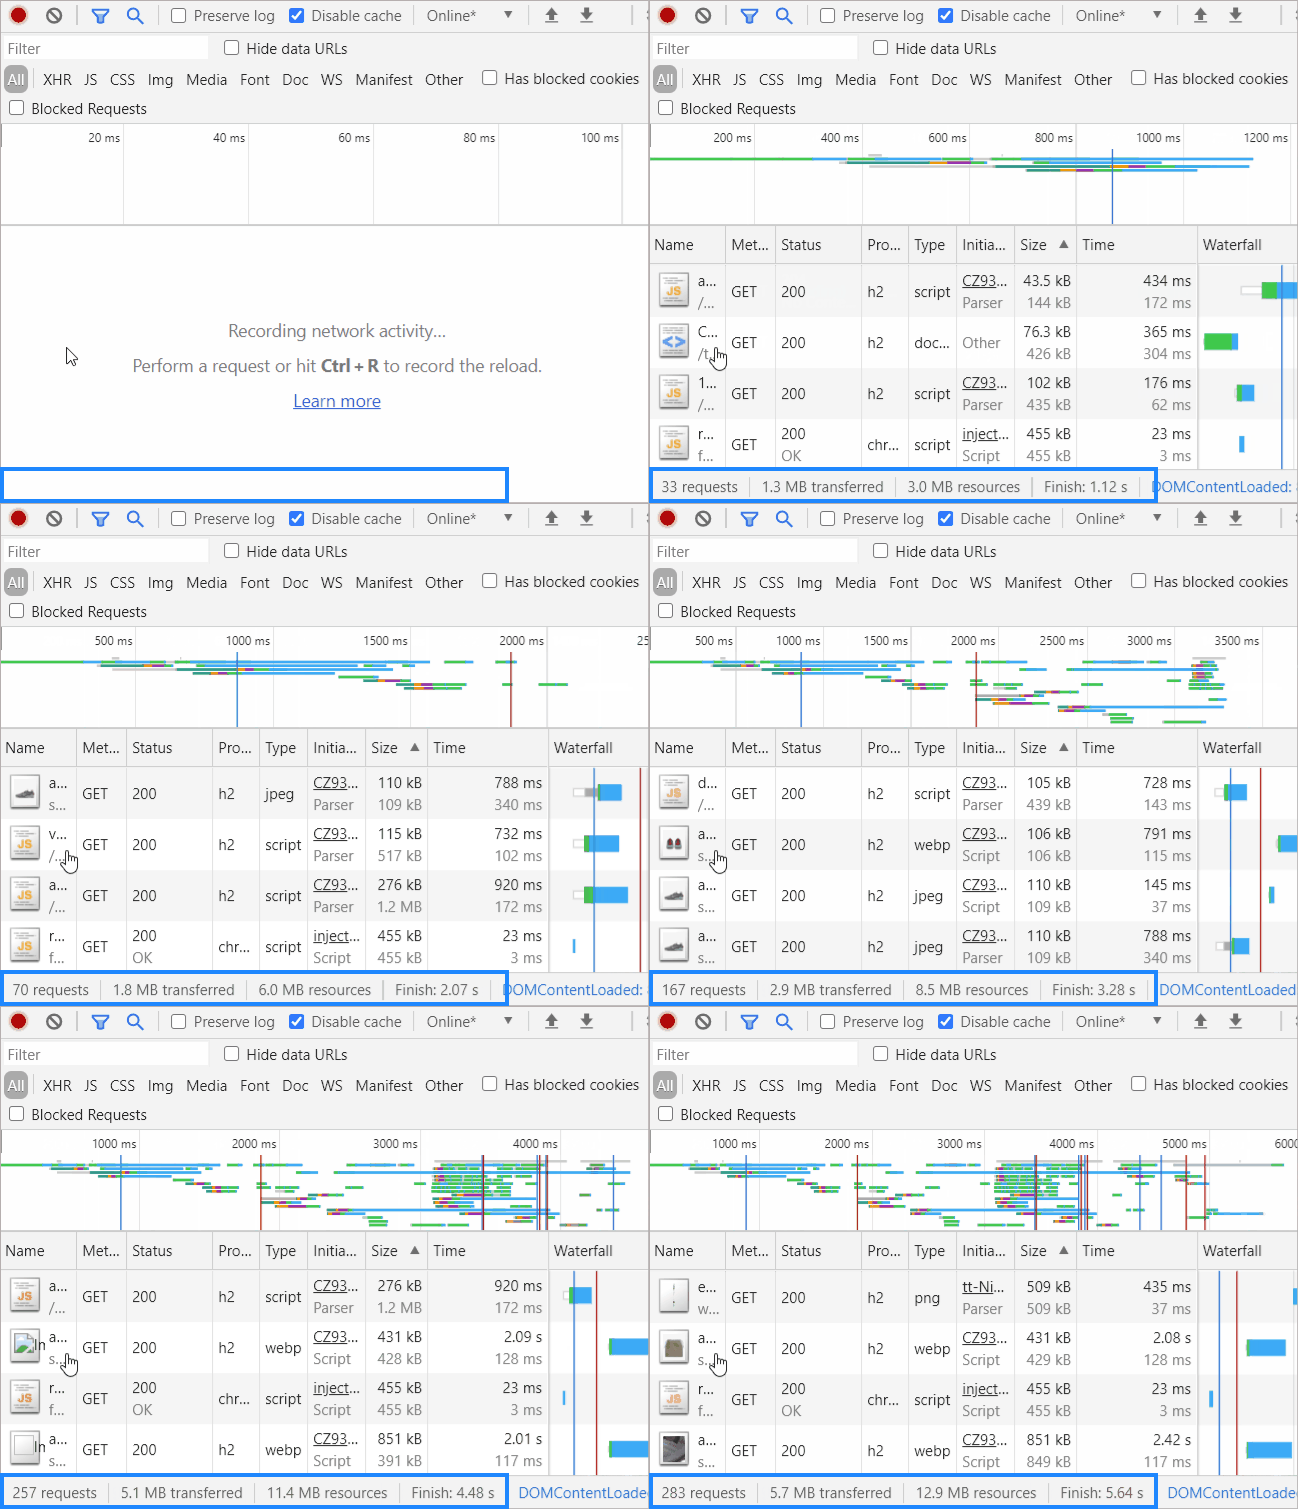
This gives us some quantitative metrics:
- The initial document took 143ms to return from the server.
- 283 total requests to load the page.
- 5.7MB transferred over the wire.
- 12.9MB of uncompressed resources.
- 5.6 seconds to finish.
283 requests is unexpectedly high, and overboard for a product details page (or really, anything). That number of requests is going to put a floor on how fast a site can be, regardless of any other improvements.
Many of the requests are served over HTTP/2, which does help with multiplexing, but it would still be better for performance to make dramatically fewer calls.
We can investigate further by filtering the Network tab to specific resource types. This lets us see the size and number of requests for each type (JS, CSS etc).
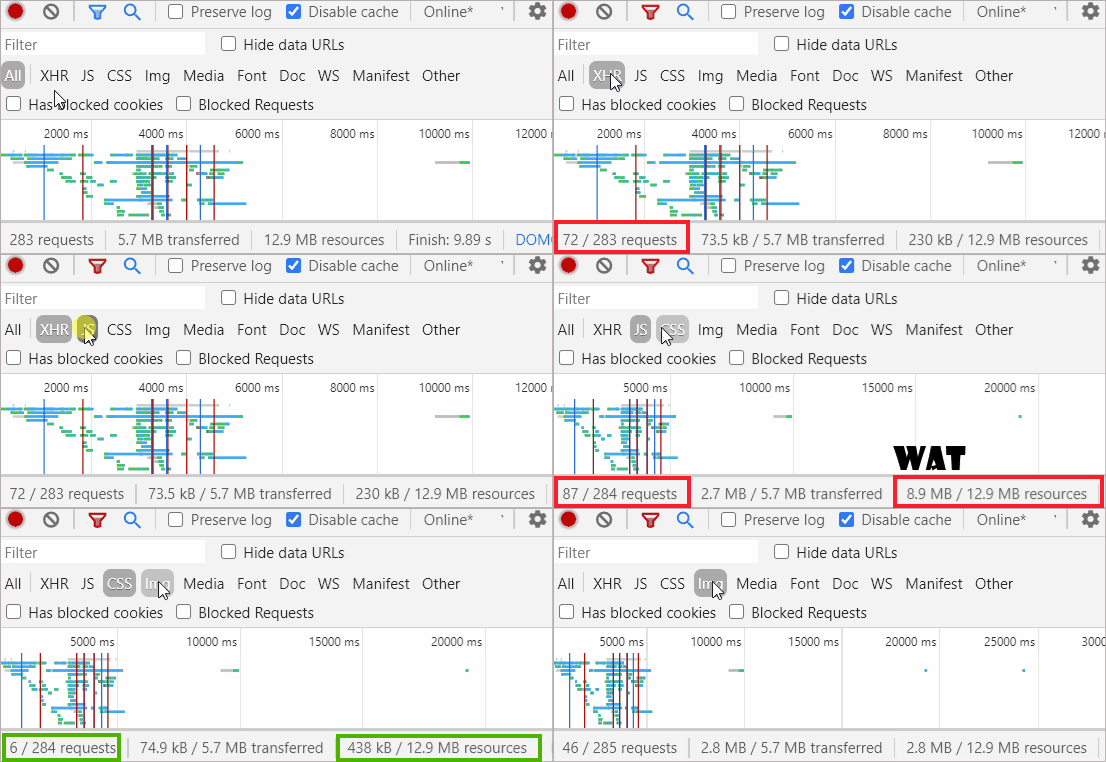
A few things stand out. First, 87 requests totaling 8.9MB of JavaScript! That is a lot of JavaScript! There are also 72 XHR/Fetch requests during page load which feels like too many. 46 image requests is also pushing it, but that’s not a huge surprise on an e-commerce site like this. The most concerning thing here is the number of JS requests, and the overall size of the script.
Diagnosing JavaScript Issues with Chrome Performance Audit
We can use the “Performance” audit feature in the developer tools to find out what’s going on with the JavaScript on this page.
Creating a performance profile gives us a snapshot of a specific page load. We get detailed flame graphs and timelines of what’s happening. If you want to play along, download the profile used in this tutorial, and load it in to Chrome to take a look.
There is a lot of information displayed in our Chrome performance profile. It can look daunting at first. Let’s break it down and go through each section individually.
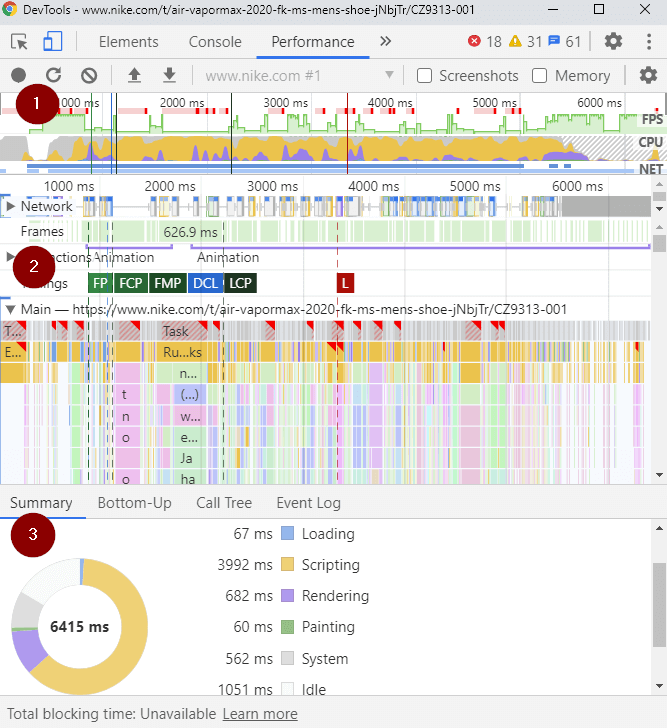
Section 1: CPU, Network and Frames Per Second Timeline
The top section (1) is where frames per second, network activity and CPU utilization are graphed over time.

Those little red lines at the top are long running tasks. Below that, in green, is the number of frames per second (FPS) the browser is rendering at. Higher is better. The lower the FPS the more jerky animations will look to the user. Below the FPS graph there’s the CPU usage meter. Yellow represents CPU time spent executing JavaScript, while purple is CPU time spent rendering.
Overall this graph tells us something specific. The long running tasks occurring in JavaScript are eating CPU and killing frames per second. When each long running task finally completes, the browser spends time rendering. This is a common usage pattern in poorly optimized/structured single page applications (SPAs).
Section 2: Flame Graphs and Page Lifecycle
The middle section of the performance profile (2) shows detailed flame graphs representing animations, JavaScript function timings and page lifecycle events.
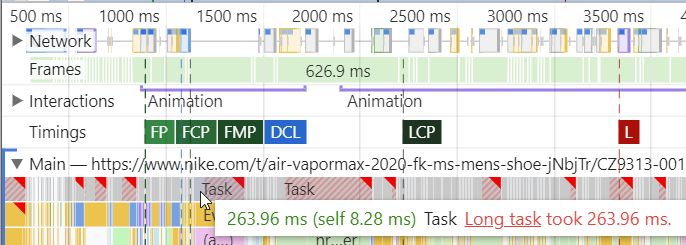
The red “L” is the OnLoad event firing. Largest Contentful Paint (LCP) and First Contentful Paint (FCP) are shown as well. We also get more detailed information on just how long some tasks were taking. These longer tasks are good places to start when investigating why the script execution is taking so long.
Section 3: Summary and Aggregate Lists
The bottom section of the profile (3) shows summary and list data.
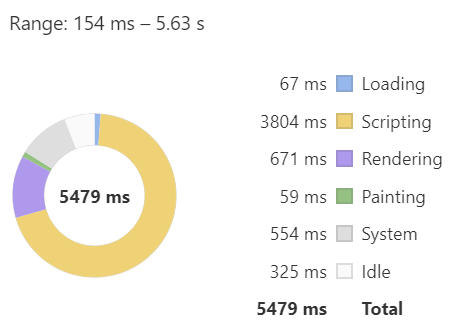
This confirms what we suspect - scripting accounts for a majority (70%) of the total time during page load. Rendering takes up the next largest chunk at 12% and is probably correlated to heavy JS usage. That is, the work JavaScript is doing ultimately results in a change to the DOM, causing rendering.
Analysis of Scripting in the Performance Profile
A good place to start when investigating script issues is the “Bottom Up” tab. This gives us a more granular view of the pie chart from the Summary tab. We can see similar time taken percentages here, but now we can expand the arrows and dive deeper.
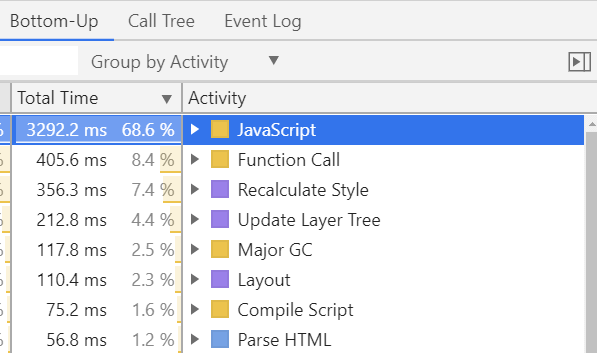
When we click in to each of these activities we get a much more detailed picture of where the time is going. Drilling in to the top-level “JavaScript” section, we see a list of the functions Chrome is spending the most time in.
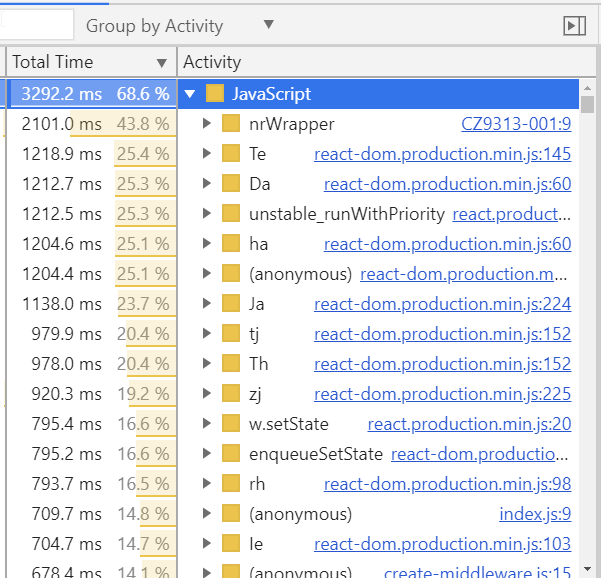
From the file names, it’s clear that a large portion of our time is spent inside React. Given the number of renders and the high CPU/low FPS, it’s likely the application is in significant need of optimization!
We can see that setState is prominently represented in the list, and repeated calls to setState will often cause layout thrashing and other poor performance issues. In terms of code improvement, drilling in to these React functions would be a good place to start!
So JavaScript is Why Nike.com is so Slow?
As with most sites, there is no single smoking gun causing all of the performance problems. In this case, 87 JS file requests and almost 9MB of uncompressed JavaScript are certainly a big factor.
Unoptimized Single Page Application
We know from the graphs that script execution is pegging the CPU and frames per second is suffering. We also know that there are too many renders occurring throughout the page lifecycle. Coupled with the amount of time spent in React, we can conclude that the React application is a large part of the problem! Spending time performance tuning the React application would help address the layout shifts and numerous contentful paints.
Too Many Scripts
There’s another JavaScript related performance problem too. Let’s look at another view of the “Bottom Up” tab on the performance profile, this time grouped by script URL:
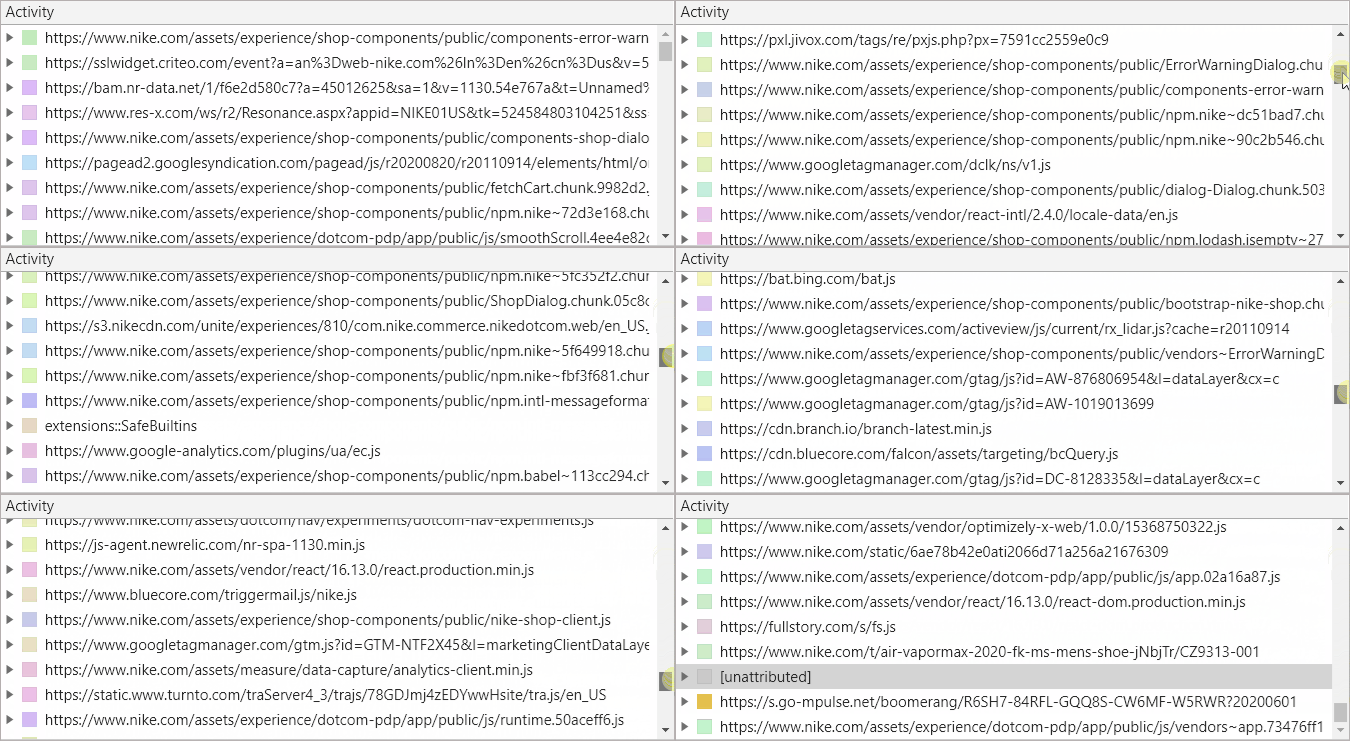
No wonder there are 87 requests and 8.9MB of script! There are numerous third party analytics and marketing products represented here, along with evidence of the internal corporate structure of Nike’s software teams. In short, this list is too long. Each of these scripts has a cost in terms of performance, and also maintenance and the quality of user experience.
If Nike wanted to improve their site’s performance they would do the following:
- Optimize their React app. Ensure judicious use of
setState. The amount of jank/layout shift on page load, coupled with the pegged CPU, strongly suggests that there are ample opportunities to batch state updates or do less work. - Remove some of their analytics and tracking third parties. There’s too many cooks in the kitchen here and each one could be contributing to poor page experience.
- Consolidate some of their first-party scripts. There’s dozens of scripts loaded from all over nike.com. It’s Conway’s Law in action.
Making these changes would be a big start towards improving performance on Nike.com!


