
Web Performance Profiling: Google.com
How is Google so fast? It’s so fast we take it for granted. It feels instant from the time you search to when results are displayed. What can we learn about the techniques they use to make their site so fast?
Google Search Results are Fast
The Google homepage is known for it’s speed, but that’s partly a function of how sparse it is. For this discussion, let’s focus instead on the Google search results page. There’s a lot more functionality and content, and it still loads incredibly fast. Here we’re searching for “request metrics” from a mobile phone.
Wow. That is almost instant. If we compare the speed of Google’s search results to our web performance profile of Nike.com, there’s no question which experience is preferable. But how does Google load those results so quickly?
Search Result Page Statistics
Let’s look at the statistics for this page load (gathered in the Network tab in Chrome Developer Tools)

- 130 requests total to load the search results
- 707 KB of assets over the wire (compressed using gzip)
- 9 JS files
- 104 image files
- 0 CSS files
Compared to many sites this is a “lightweight” page load, but there’s still over one hundred requests. And there’s three quarters of a megabyte of assets shipped over the wire.
Interestingly, Google is using gzip for compression instead of their own Brotli algorithm, even though my browser will accept either. In benchmarks Brotli can be configured to increase compression and performance compared to gzip, so it’s not clear why they’re making this choice.
Overall these statistics are OK, but they don’t explain the speed we see. The most notable insight here is that there are zero external CSS files.
Where are the styles coming from?
The browser did not request a single CSS file, and yet the page is styled nicely. Let’s look at the HTML that we got back from Google to see if we can figure out where the styles are coming from.
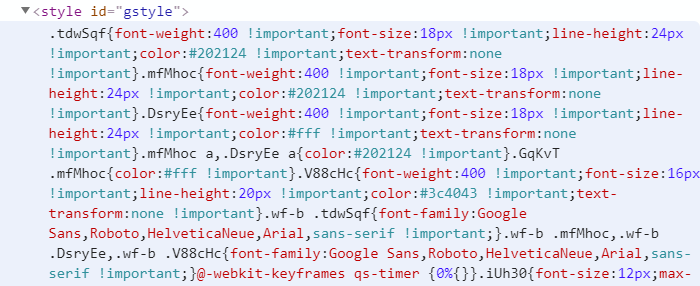
They are inline! Google is inlining the CSS and sending it out with the page response. This allows the browser to render the styled content without waiting for an external resource to come back. But Google doesn’t just inline CSS.
Inline Every Static Resource
Google takes inlining seriously. Not only do they inline the styles, they inline their JavaScript!
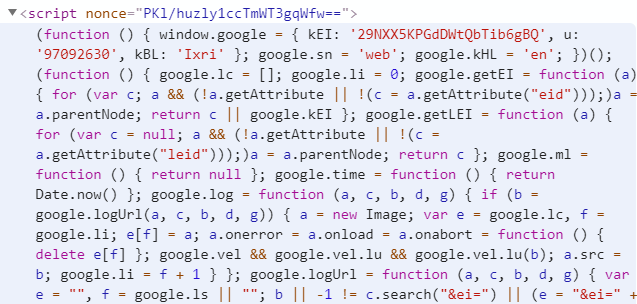
In fact, we can run some selectors against the page to see just how pervasive the inlining of scripts and styles is.
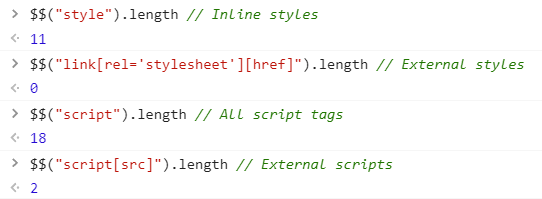
We can see that of all the scripts and styles on the page, everything is inlined except 2 external JavaScript files. (Note: those two external scripts dynamically load additional JS files which is how we get 9 total on page load).
What if We Don’t Load Any External Assets?
To illustrate just how far Google has taken the concept of inlining static resources, let’s only load the HTML. No other external assets. No external JavaScript, no external images, no external anything. I saved the HTML response from Google and opened it with my network turned off. How does it look?
It looks great! There’s even favicons for all the search results. The hamburger menu doesn’t work, and the images carousel towards the end is missing its images. But everything else looks pretty good.
Earlier we saw that 104 image files were loaded during the real page load. And yet, we see most of the images working here. What gives?
Inlining Images with Data URIs
Google is using a clever optimization with most of the images. If we look at the Request Metrics favicon image in the inspector we can see that the image has a special src URI - a Data URI! The binary image content is Base64 encoded and shoved directly into the src attribute.
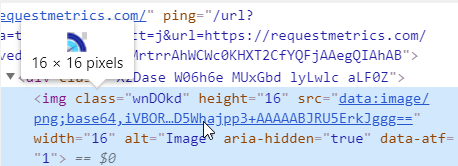
Using Data URIs is yet another way Google shows their commitment to inlining assets. It’s a perfect technique to use when there’s many small images to display. The Data URI approach has diminishing returns for larger images since it bloats the page size. That’s why the “Images” carousel is blank - they are still using externally sourced images to populate that section.
Important: It’s worth noting that each one of these Base64 encoded images is counted as a “request” in the Network tab of Chrome developer tools. This explains why there are so many images “requested” but the page is so fast. The browser never goes over the network to get them! Here’s what they look like in the developer tools:

Inlining For Speed
Google’s dedication to inlining JS, CSS and images shows how important it is for maximizing performance. Every external request the browser makes is a performance problem waiting to happen.
Google is taking no chances here. Once a user’s browser receives that very first response from Google, it can render 90% of the UI without going over the wire again. This speeds things up and also mitigates slow or unreliable networks.
Of course, getting that first response to the user quickly is also important. And 90% is not 100% - there are other requests necessary for a fully featured experience. Inlining is not the only thing Google does to be fast.
Google’s Fast Edge Network
Optimizing the content of a page is important, but perhaps equally important is delivering that page and its associated resources quickly over the wire.
A Globally Distributed Infrastructure
Google runs a robust network with multiple layers of infrastructure to ensure that requests are handled as close to the end user as possible. They have numerous peering arrangements with ISPs around the world, and a comprehensive edge caching setup that ensures static resources are almost always nearby.
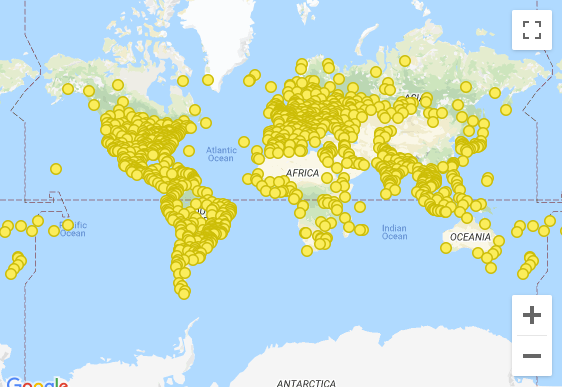
It’s difficult to objectively measure the performance of Google’s network with traditional tools like ping, but we can look at how things perform in our browser.
The Initial Search Results Response
Here’s what the developer tools say about our search results loading times:

The initial request to Google had a time to first byte (TTFB) of 145 ms (the blue box). That is, the browser started receiving the response from Google after 145 milliseconds. That’s pretty fast. The overall time to finish reading the response was 880 ms (orange box). This includes the time to download the entire response from Google.
Remember, because of Google’s aggressive static content inlining, 90% of the UI can be displayed to the user once the response is finished.
The Static Content Is Even Faster
There are a few external JavaScript files retrieved during page load.
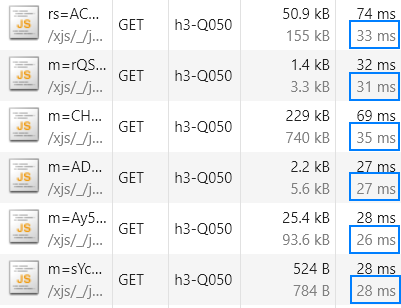
These files all have an average TTFB of ~30 ms. This suggests the server is nearby, with minimal hops between my browser. Considering I loaded this page over a Comcast internet connection, this is a solid response time.
The Protocol Makes A Difference
Not only are the Google servers nearby, they’re also serving files using a new protocol. You might have noticed the value h3-Q050 in the screenshots above. That’s because the browser is talking to Google over HTTP/3.
It’s still a draft standard, but the main difference between HTTP/3 and HTTP/2 is that TCP is no longer the underlying connection protocol. They’ve adopted QUIC instead of TCP because it improves performance:
[QUIC] does this by establishing a number of multiplexed connections between two endpoints over User Datagram Protocol (UDP). This works hand-in-hand with HTTP/2's multiplexed connections, allowing multiple streams of data to reach all the endpoints independently, and hence independent of packet losses involving other streams.
How to Be Fast, Like Google
Most companies don’t have access to Google’s network or vast developer pool, but the same ideas they use to make their pages load quickly can be applied to any site.
Make Less Requests
Google takes it to a new level, but avoiding network requests is major factor in improving web performance. Even with newer HTTP protocols, bundling assets to coalesce static content is still a good idea. If you can inline some JavaScript or CSS that’s even better. Using data URIs to transmit small images can also help. Networks are unreliable, and every request the browser makes has the potential to fail or be delayed.
- html-webpack-inline-source-plugin - for inlining all CSS and JS.
- style-loader- if you just want to inline your styles.
- url-loader - building Data URIs from images or other sources.
Use CDNs and Modern Protocols
It’s unlikely you’ll have access to a network quite as sophisticated as Google’s, but modern cloud providers offer many similar features. Things like purpose-built CDNs and dynamic geo-based DNS routing are available to anyone.
Hosting static content on a CDN is an easy way to get some of the network benefits Google enjoys, including HTTP/2 or HTTP/3 support. And using a geo-aware DNS solution let’s you take data locality to the next level if that’s important for your use case or customer base.
Even if you don’t use the cloud, third parties like BunnyCDN and Fastly make it simple to deliver static content from around the globe. And there are DNS providers like easyDNS offering full GeoDNS routing.
Google is one of the premier web properties on the Internet, and the company is driving many new web standards. It’s no surprise their site is one of the fastest. For everyone else, we’ve built Request Metrics. Now you can see how your users really experience your site.


