Explaining Performance to Non-Technical Stakeholders
Whether you’re an e-commerce company, a SaaS provider, or a content publisher, understanding the performance of your website is important to everyone on the team—not just the developers. Performance is a huge part of the user experience and directly tied to how well your website achieves its goals. But web performance is often measured in very technical terms, like Largest Contentful Paint, that cause most business folk’s eyes to glaze over.
This language gap is a big part of the reason why many websites are so slow. Many only consider performance from their own perspective—“it’s fast for me”—and leave it at that. We simply lack the vocabulary to talk about the problem.
To effectively talk about web performance with everyone on the team, you have to break through the jargon and talk about what really matters: the experience of the real users and how that impacts the business. Here’s a few ways to do that:
Push what’s Important
Performance is rarely top of mind, and it’s unlikely anyone will go looking for it unless a user is complaining. Most users don’t complain—they just leave.
To keep your users, you need to know about performance before it gets bad. You need to know when it’s important.
At Request Metrics, its our job to figure out what’s important and push the relevant information to you. We examine all your web performance data and push a summary to your inbox with what you need to know.
And to make it sharable, we publish it as a PDF so that you can forward it on to your client, your boss, or the executives in charge.
BLUF: Bottom Line Up Front
This old military acronym is about getting right to the most important information first—lives could depend on it!
Your situation is (probably) not that dire, but the advice stands. If the most interesting performance anomalies are buried three clicks deep, it’s unlikely to be discovered.
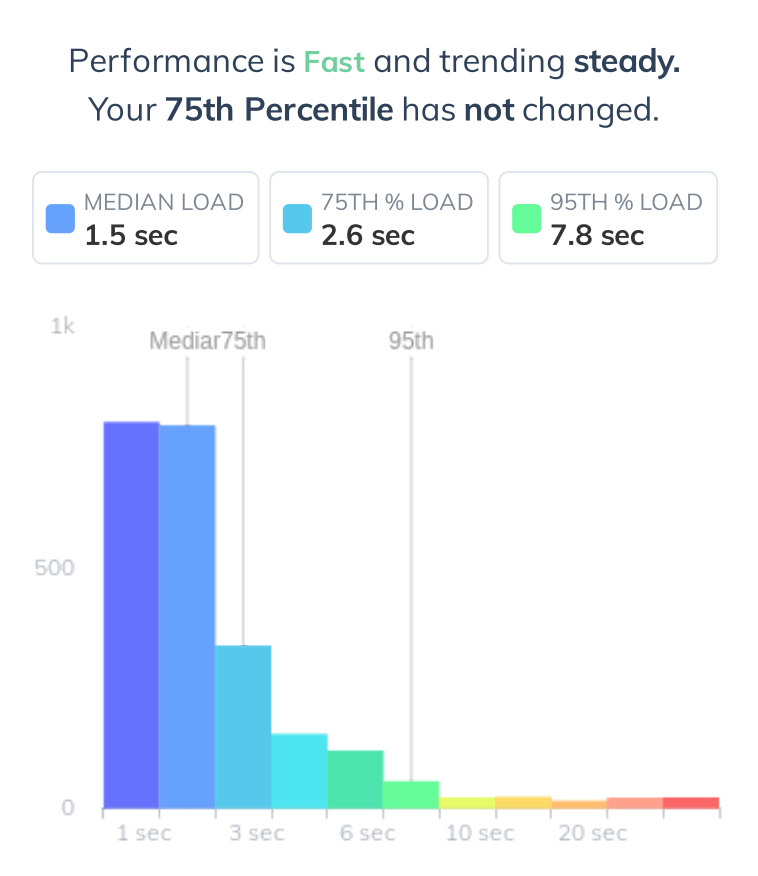
At Request Metrics,we expose the interesting things in plain language at the top of all of our reports and dashboards.

This takes the burden off the developer to interpret the data for their team. We can plainly state what’s happening, backed up with data.
Describe Metrics as User Impact
Web performance metrics are highly technical and confusing—even to developers. If you don’t understand what Cumulative Layout Shift is measuring, its hard to care that the score isn’t good.
Instead, start the conversation with the user impact of the metric, like “the website has a lot of frustrating shifting of content for 75% of our users”
We’re working on better ways to solve this problem by combining user analytics with web performance, and errors. With Request Metrics, you can correlate the problems that have real business impact and communicate in business terms.
Performance can be a powerful way to make your websites better and more effective—but only if you know how to have the conversation. Remember to Push what’s important to your stakeholders, put the bottom line up front, and describe metrics in terms of user impact. If you have the real user data and reports from Request Metrics, that will help.
Have a look at the example performance report and see how it can help drive the performance conversation on your team.


