Why We Are Different
Web performance isn’t a single number—it’s a story. Request Metrics ties this story together, unifying synthetic tests, real user data, and Google’s rankings. With deep insights, actionable fixes, and the best support in the business, we help you make your site faster where it actually matters. No fluff, no investors, just a small team dedicated to real performance monitoring.
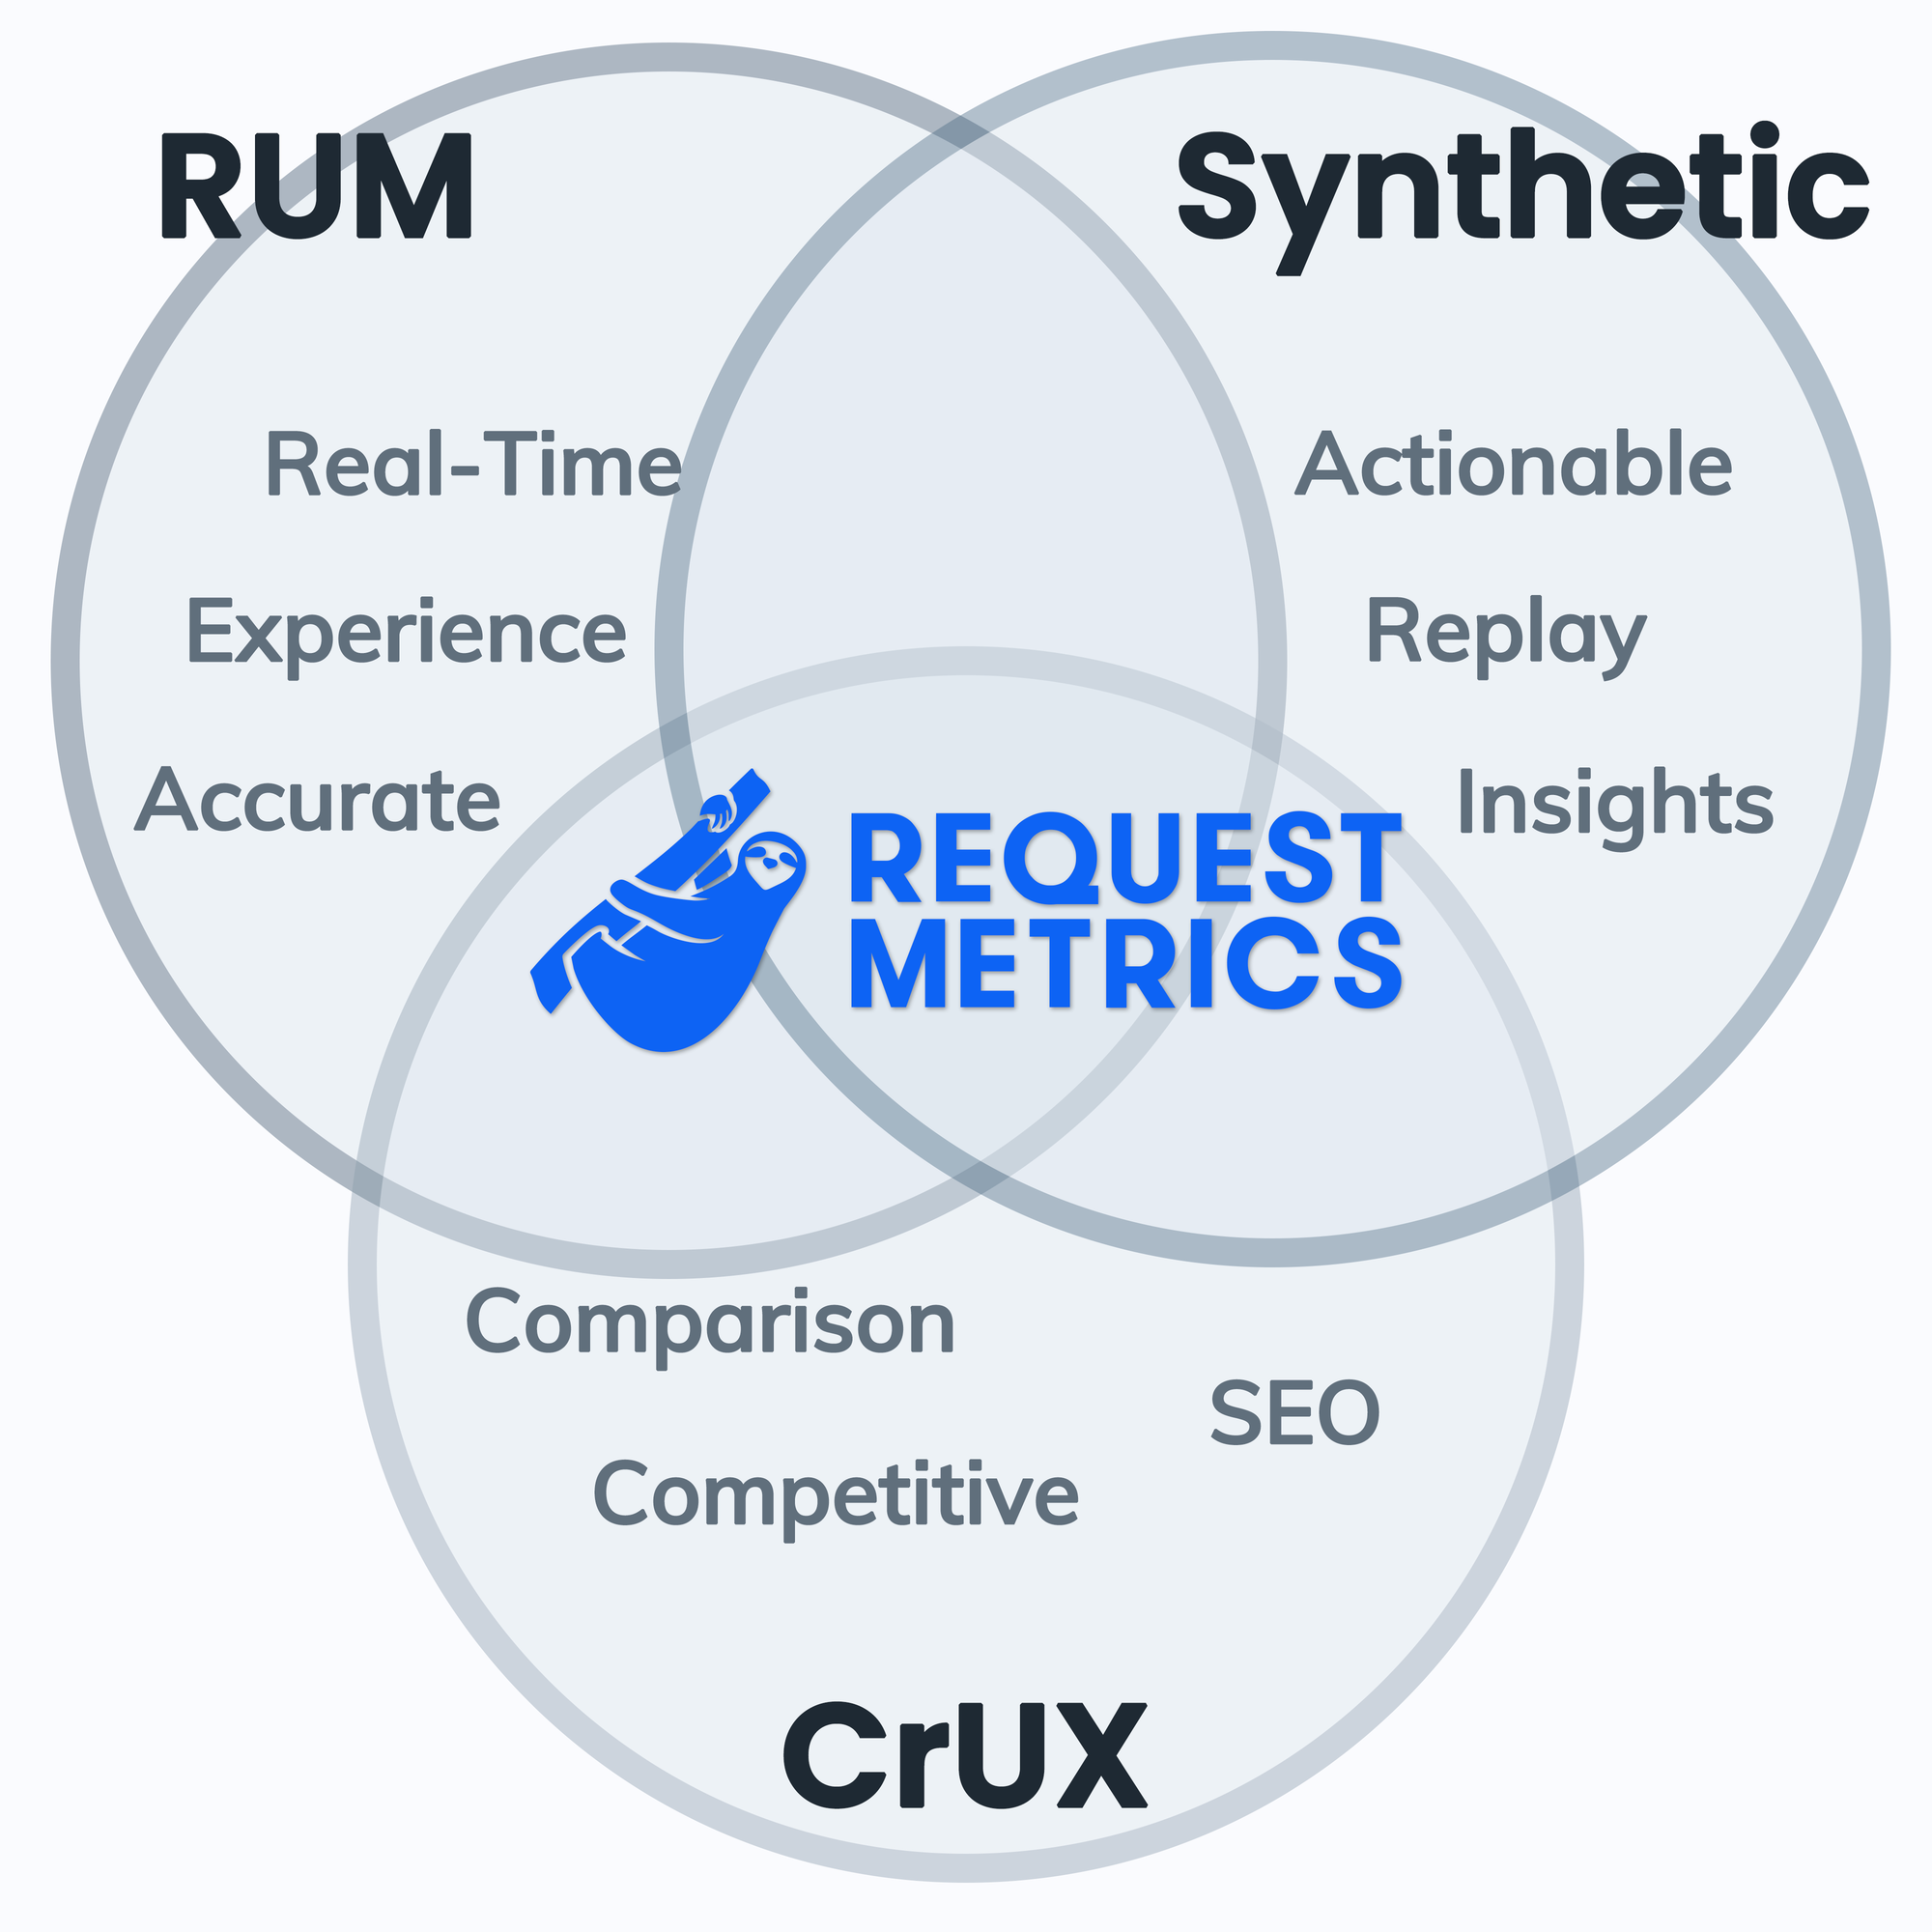
Unified Web Performance
There’s no single metric that tells the full story of your site’s performance. A lab test might say your site is fast, but your real users could be suffering. Real User Monitoring (RUM), synthetic reports, and Google’s Core Web Vitals all provide different perspectives. Request Metrics brings them together, so you can make informed decisions that actually improve your site.
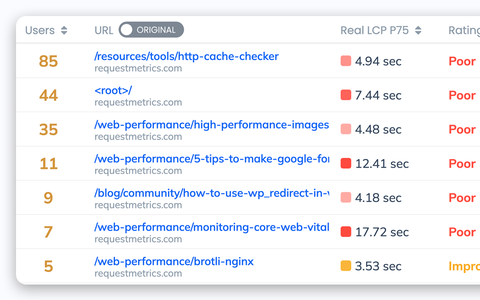
Real User Monitoring (RUM) That Answers Your Questions
-
Know where to focus. RUM data highlights the pages that need attention based on real users experience.
-
Traffic matters. A slow page that no one visits doesn't matter–but a slow checkout page is a problem.
-
Filter out the noise. Filter performance by country, device, browser, or even individual sessions to understand performance patterns.
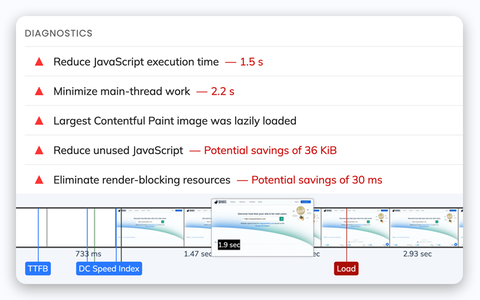
Synthetic Tests for Useful Recommendations
-
Immediate Feedback. See what’s slowing your pages down and get actionable fixes: smaller images, less JavaScript, better caching.
-
Visualize Performance. Recreate the loading experience of your users with high-fidelity load screenshots.
-
Identify Problems. Find and fix potential problems before they slow down your users.
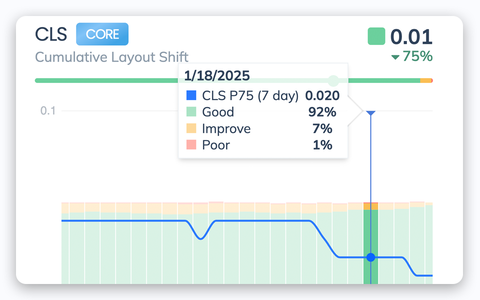
Chrome UX Report for Competitive Comparisons
-
See what Google sees. CrUX data helps confirm if your RUM improvements are actually making a difference in search rankings.
-
Long-term validation. Performance changes take time to show up in Google’s data—keep tabs to ensure your improvements last.
-
Competitive insights. Compare your performance against competitors to stay ahead in SEO and user experience.
Integrated Analytics, Errors, and Observability
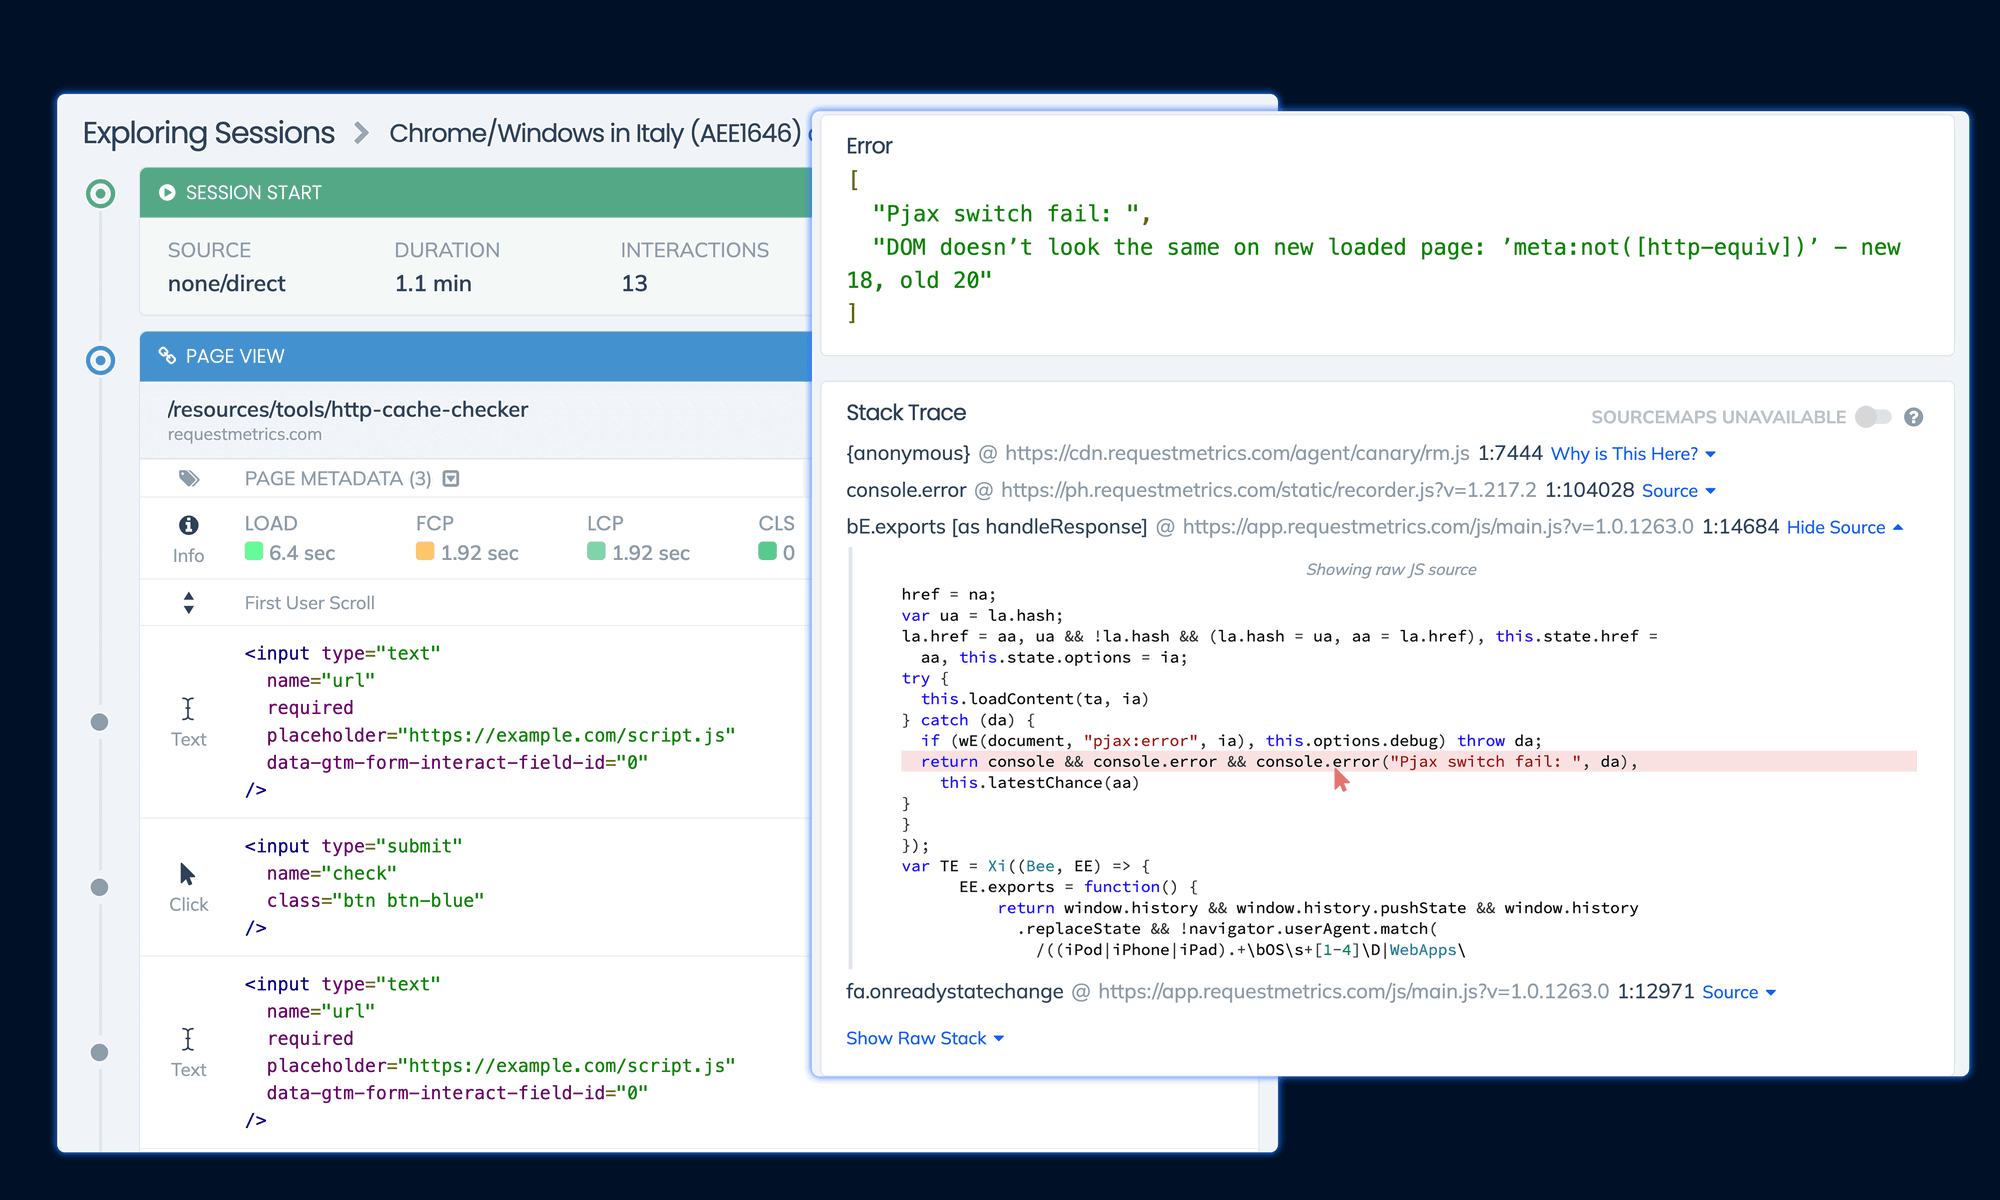
We do more than just speed—we help you understand the entire user experience. Request Metrics gives you additional insight into traffic sources, engagement rates, JavaScript errors, and API availability, making it easier to diagnose and fix problems before they affect your users.

Our small team that cares
Request Metrics is built by developers who have spent 20 years making software that’s simple and fast. No investors. No bloat. No BS. Just a team of experts focused on giving you the best performance monitoring experience possible.
Learn more about us
The best support in the business
We don’t have a faceless support queue. When you reach out, you talk to an actual expert who can solve your problem—fast. Whether you’re troubleshooting a performance issue or need help setting it up, we’re here to make sure you succeed.

Sustainable. Independent. Here for the Long Haul.
We’re not chasing VC funding or an exit strategy. We build Request Metrics to be a sustainable, profitable business that serves you, not investors. That means no shady pricing tricks, no upsells, and no selling your data. Just great software that helps you build a faster web.
What our customers say
Request Metrics showed us all the unused marketing pixels and vendor rubbish that was slowing down our users.

Quick and easy insights into why you're site is failing Core Web Vitals. Use Request Metrics!.

The engineering team behind this make Request Metrics an incredible value. I cannot recommend enough.


