Professor Sloth

Free web performance master class

Learn about web performance and how to make your site faster, delivered straight to your inbox.

Long Animation Frames (LoAF): Toasting User Interactivity

Long Animation Frames (LoAF): Toasting User Interactivity

Long Animation Frames (LoAF)

A Long Animation Frame, often called a LoAF, occurs when your website’s animations take too long to render, slowing down interactions and making your site feel “frozen” or “janky.” And yes, it’s hilarious that it sounds like a loaf of bread—so get ready for plenty of bread, butter, and toasting puns!

You might be thinking, “I’m building an online store (or whatever), what do I care about animations? I’m not talking about cartoons. In this context, an “animation” refers to all the work that goes into drawing your web page at any specific moment. A “frame” is what your page looks like at a single instant in time. Yes, like frame in a cartoon.

For instance, let’s say you show a loading spinner after the user clicks on a button. From the time the user clicks the button until the spinner is visible, that entire process is considered one animation frame. It includes all the work the browser does:

  • to handle the event
  • send it to your script
  • do your JavaScript work
  • process the element changes
  • update the document layout
  • paint

That’s a lot of work. Ideally, animation frames on the web should happen about 20 times per second for users to feel like the website is fast and interactive. That gives the browser around 50 milliseconds to complete all its tasks (and run any JavaScript) to render each frame.

Here’s what that looks like in Chrome DevTools:
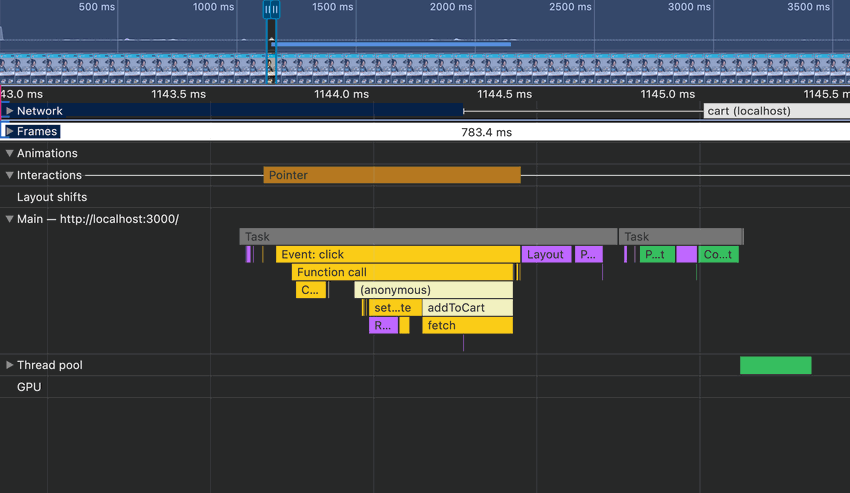
Interactions, event handling, and render cycle in Chrome DevTools Performance

When those tasks take longer than 50 milliseconds, the browser flags it as a “long animation frame.” This can make the user feel like the site has locked up or lagged, with animations that stutter. The longer these frames take, the worse the experience becomes for your visitors—kind of like butter scraped over too much bread.

If you’re building an immersive experience like a game or video player, you probably need animations to render even faster, closer to 60 frames per second.

Brief history of the Long Animation Frame API

The Long Animation Frame (LoAF) API is a relatively new concept in web performance, introduced by Google in Chrome 123 in January 2024. The API was designed to fill a gap left by the Long Tasks API, which, while useful for identifying some heavy tasks on the main thread, didn’t give developers enough insight into slow rendering issues.

LoAF began as a limited origin trial in Chrome 116 in August 2023, where it was tested using real data on live websites. After gathering insights from this trial, it was fully released for all developers in Chrome 123.

It’s important to note that, as of its release, the LoAF API is only supported in Chrome, and you won’t find it in Safari or Firefox yet. While it’s a powerful tool for tracking performance, cross-browser support is still a work in progress.

Long Tasks vs Long Animations

While the Long Tasks API has been helpful in identifying performance bottlenecks, it doesn’t tell the full story of laggy web interactions. Long Tasks measure activity on the main thread that takes longer than 50 milliseconds to complete, including things like heavy JavaScript execution and event handling.

So what’s the problem with tasks?

The Long Tasks API doesn’t include the rendering phase. All the work that goes into parsing the DOM and understanding the layout isn’t considered. A page with a really complicated layout and nested DOM could be painful to interact with, but the Long Tasks API wouldn’t report it.

The rendering phase isn’t just browser internals either—it includes JavaScript callbacks from requestAnimationFrame, which can handle quite a bit of work in some applications. (It’s also super useful for solving LoAF issues, but we’ll butter that bread later on.)

Another burn on the Long Tasks API is its basic attribution model. It shows you which task took too long but doesn’t offer much insight into what caused it. It didn’t provide a call stack to show what called the script or why. This made the data from Long Tasks hard to use. We knew there was a problem, but not when, where, or why.

Instead of measuring tasks, the Long Animation Frame API measures user impact—specifically, the visible time to animation. It focuses on performance issues in the rendering phase that Long Tasks misses.

It also solves another problem: there can be many tasks within an animation frame. Even if no individual tasks are flagged as “long,” their collective impact can cause the frame to slow down. Dozens of short tasks might seem harmless, but together they create the lag and “jank” that users feel when animations stutter.

By targeting the animation frames themselves, the LoAF API provides much more actionable data for developers, helping you identify exactly when and why animations are slow, even if it’s due to a combination of smaller tasks.

Why Long Animation Frames matter for web performance

LoAF impact on user experience

User experience is all about smooth and expected interactions. But when your site has long animation frames (LoAFs), you’ll end up with jerky, unresponsive animations that cause users to be unsure of what is happening.

Developers sometimes call this “jank”. Jank is the enemy of a fast and fluid web experience. When animations stutter or freeze due to long animation frames, users are left feeling frustrated, and confused, as if your site is barely keeping up with their interactions.

Imagine clicking a checkout button and having the page pause awkwardly before responding. These are real-world examples of LoAFs in action. A couple of milliseconds may not seem like much, but when enough long animation frames stack up, your site feels sluggish and unresponsive—like trying to spread dried out peanut butter.

LoAFs might be happening more often than you think, especially in moments where users are engaging with your site the most, such as during form submissions, button clicks, or content updates. Catching and fixing these janky moments can make your site feel infinitely faster and more intuitive.

Accessibility and Long Animation Frames

Beyond performance, long animation frames can also have a significant impact on accessibility. Users who rely on assistive technologies—like screen readers or keyboard navigation—can be particularly sensitive to laggy interfaces. When interactions are slow, these users may experience delays that prevent them from engaging with your site. For users with motor disabilities or cognitive impairments, even slight delays can result in a frustrating and difficult experience.

By reducing long animation frames, you not only improve the general performance of your site but also make it more accessible to a wider audience. Optimizing for LoAFs isn’t just about speed; it’s about building a site that’s usable by everyone, regardless of how they access it. Improving accessibility scores directly benefits your SEO and user satisfaction as well.

Mobile Devices have worse Long Animation Frames

Mobile users tend to have less powerful hardware—slower processors, less RAM, and sometimes spotty network connections. Add in long animation frames, and you’ve got a recipe for a particularly frustrating mobile experience. LoAFs can have an even bigger impact on mobile devices because mobile CPUs simply aren’t as powerful as their desktop counterparts.

That means the same animation frames that might run okay on a desktop could struggle on mobile, creating more noticeable stuttering or unresponsiveness. It’s important to focus on optimizing for mobile specifically, as mobile traffic is only continuing to grow.

LoAF and your Core Web Vitals

Google has made it clear that web performance is crucial for SEO, and one way to measure this is through Core Web Vitals. One specific metric, INP (Interaction to Next Paint), is directly impacted by long animation frames. INP measures how long it takes after a user interacts with your site for the page to become visually responsive. If LoAFs are present, INP will take a hit, meaning that your site will feel slow and unresponsive, which can negatively affect your Core Web Vitals score.

Since Core Web Vitals are a ranking factor in Google’s search results, fixing LoAFs becomes critical not just for user experience but for SEO as well. Google prioritizes fast, interactive websites, and LoAFs stand in the way of achieving that. By addressing LoAF issues, you’re not only improving your site’s usability but also giving it a better chance to rank higher in search results.

Where Does LoAF Data Come From?

LoAF data is produced by the Chrome Browser Engine, which tracks the timing of animation frames—the moments when your site is visually updated. By monitoring when these frames take too long to render, LoAFs provide actionable insights into where your site feels slow or unresponsive to users. This makes LoAF data different from more traditional performance data sources, which often focus on load times or resource usage without pinpointing interactive issues that directly impact user experience.

LoAF from Lab Data vs Field Data

When optimizing for LoAFs, it’s important to understand the differences between lab data and field data. Lab testing for web performance (sometimes called synthetic testing) refers to testing in controlled environments, where you simulate interactions to gauge performance under ideal conditions. This type of testing is useful for catching performance issues early in development, ensuring that your site works well before it goes live. These are tools like Chrome Lighthouse, PageSpeed Insights, and WebPageTest.

However, lab testing has limitations—it often doesn’t reflect the range of real-world devices, network conditions, or usage patterns that your actual users will experience. It’s also difficult to simulate user interactions with these tools.

Field testing for web performance is gathering data from the real users and they interact with your live website. It provides a more accurate representation of how LoAFs affect different devices and connection types, making it invaluable for understanding your site’s performance in real-world scenarios. These tools are called Real User Monitoring or RUM, like Request Metrics.

Long Animation Frames are most useful when collected from real-time from users interacting with your site, such as with a Real User Monitoring tool. LoAF data from real users gives you an accurate picture of how animations and interactions perform under actual conditions.

How to Track Long Animation Frames

The Long Animation Frame API is designed to help developers track when animation frames take longer than expected to render, leading to performance issues like jank or unresponsive interactions. It works by monitoring the time it takes for a frame to be completed and flags any frame that exceeds a threshold—typically 50 milliseconds.

The API makes this data available via the PerformanceObserver and Performance objects.

The easiest way to track this data is using a Real User Monitoring tool like **Request Metrics**, which will automatically capture, normalize, and report this data.

Using PerformanceObserver to capture LoAF

The PerformanceObserver is a powerful way to track performance-related entries, including long animation frames. The Long Animation Frame API integrates with the PerformanceObserver to track LoAFs as they occur, and developers can use this observer to handle and act on these entries in real time.

Here’s an example of how to use the PerformanceObserver API to capture LoAFs:

if (window.PerformanceObserver) {
  const observer = new PerformanceObserver((list) => {
    list.getEntries().forEach((entry) => {
      console.warn(`LoAF at ${entry.startTime} lasting ${entry.duration}ms`);
    });
  });

  observer.observe({ type: 'long-animation-frame', buffered: true });
}
Measure Long Animation Frames with PerformanceObserver

This code sets up an observer to listen for long-animation-frame events and logs them to the console. You can adapt this to trigger other actions, like sending data to a backend for real-user monitoring (RUM).

The buffered option of PerformanceObserver is important because it allows us to create the observer lazily and receive older events. Here is the shape of the long animation frame entry:

{
  "blockingDuration": 0,
  "duration": 201,
  "entryType": "long-animation-frame",
  "firstUIEventTimestamp": 0,
  "name": "long-animation-frame",
  "renderStart": 271,
  "scripts": [
    {
      "duration": 16,
      "entryType": "script",
      "executionStart": 253.3,
      "forcedStyleAndLayoutDuration": 14,
      "invoker": "#document.onDOMContentLoaded",
      "invokerType": "event-listener",
      "name": "script",
      "pauseDuration": 0,
      "sourceURL": "https://requestmetrics.com/js/main.js",
      "sourceFunctionName": "onReady",
      "sourceCharPosition": 196,
      "startTime": 253.31,
      "window": [Window object],
      "windowAttribution": "self"
    }
  ],
  "startTime": 79.1003,
  "styleAndLayoutStart": 271
}
Sample Long Animation Frame report

Each Long Animation Frame entry contains an array of scripts that were running during the frame. This is part of what makes LoAF much more actionable than the Long Tasks API.

For a detailed explanation of each field, see the Long Animation Frame specification from W3C.

The PerformanceObserver is the recommended way to monitor for Long Animation Frames because it minimizes the impact on the website being monitored.

Using the Performance API to capture LoAF

The Performance API is another essential tool for capturing LoAFs and other performance-related metrics. It provides a broader set of performance entries on demand, allowing you to gather more advanced performance information. Here’s how you would get Long Animation Frames from the Performance API:

const longFrames = performance.getEntriesByType('long-animation-frame');
longFrames.forEach((entry) => {
  console.warn(`LoAF at ${entry.startTime} lasting ${entry.duration}ms`);
});
Measure Long Animation Frames with the Performance API

This simple example grabs all entries of type long-animation-frame from the performance timeline, letting you analyze them post-render. You can combine this data with other metrics to build a more comprehensive understanding of your site’s performance.

Using web-vitals.js to capture LoAF

Long Animation Frames contribute to poor [Interaction to Next Paint (INP)] scores, one of the critical [Core Web Vitals]. To help developers monitor Core Web Vitals and other performance metrics, Google built the open-source web-vitals.js library.

While the web-vitals library doesn’t expose LoAFs directly, its attribution build includes the long animation frames relevant to each INP entry. These long animation frames are likely the ones causing the most significant performance issues for users, making this an effective way to track LoAFs indirectly.

Here’s how you can use web-vitals.js to capture long animation frames through the INP metric:

import { onINP } from 'web-vitals/attribution';

onINP((inpEntry) => {
  inpEntry.longAnimationFrameEntries.forEach(console.log)
});
Measure Long Animation Frames web-vitals.js

In this example, onINP listens for Interaction to Next Paint (INP) events, and the longAnimationFrameEntries array provides access to the long animation frames that are tied to that specific INP entry.

Show Long Animation Frames in Chrome DevTools

As of Chrome 131, Long Animation Frames aren’t natively exposed in Chrome DevTools. However, using the extensibility API, we can add them to the Performance Panel for developer-time performance analysis.

The Chrome Performance Panel already captures data on frames and animations, but long animation frames aren’t directly available. By leveraging the Performance API and extending a custom measure with the devtools option, you can expose LoAF data in DevTools. Here’s how to do it:

const observer = new PerformanceObserver((list) => {
  list.getEntries().forEach((entry) => {
    performance.measure('LoAF', {
      start: entry.startTime,
      duration: entry.duration,
      detail: {
        devtools: {
          dataType: 'track-entry',
          track: 'Long Animation Frames',
          color: 'primary',
          tooltipText: 'Long Animation Frame',
          properties: [
            ['blockingDuration', entry.blockingDuration],
            ['firstUIEventTimestamp', entry.firstUIEventTimestamp],
            ['renderStart', entry.renderStart],
            ['styleAndLayoutStart', entry.styleAndLayoutStart]
          ]
        }
      }
    });
    entry.scripts.forEach((script) => {
      performance.measure('Script', {
        start: script.startTime,
        duration: script.duration,
        detail: {
          devtools: {
            dataType: 'track-entry',
            track: 'Long Animation Frames',
            color: 'secondary',
            tooltipText: 'Script Execution',
            properties: [
              ['invoker', script.invoker],
              ['invokerType', script.invokerType],
              ['sourceURL', script.sourceURL],
              ['sourceFunctionName', script.sourceFunctionName],
              ['sourceCharPosition', script.sourceCharPosition],
              ['forcedStyleAndLayoutDuration', script.forcedStyleAndLayoutDuration],
              ['pauseDuration', script.pauseDuration],
              ['windowAttribution', script.windowAttribution]
            ]
          }
        }
      });
    })
  });
});

observer.observe({ type: 'long-animation-frame', buffered: true });
Show Long Animation Frames in Chrome DevTools Performance

This code listens for long-animation-frame events and creates custom performance measures that are exposed in DevTools. By integrating LoAF data directly into DevTools, you can track Long Animation Frames as they occur and gain more insight into how they affect user interactions.

The result will look something like this in the Performance Panel:
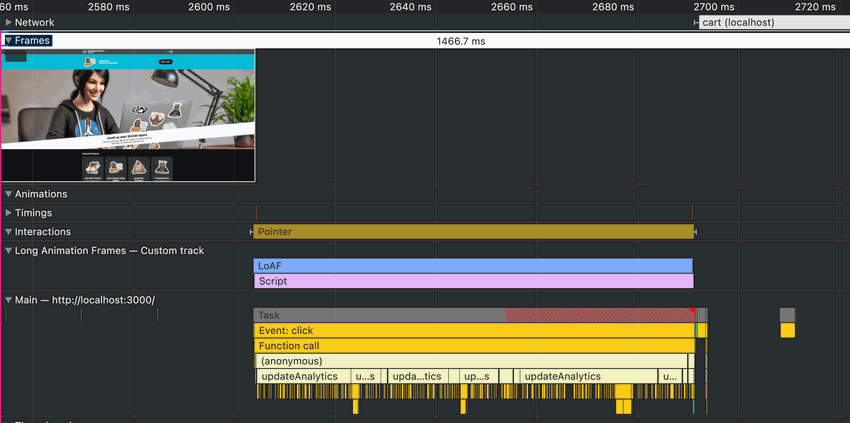
Show Long Animation Frames in Chrome DevTools Performance

Analyzing LoAF Data

Once you’ve captured Long Animation Frames (LoAFs) from the API or your Real User Monitoring tool, it’s time to dig into the data and make it actionable. Whether you’re viewing the data in a dashboard like Request Metrics or through other tools, understanding how to read and interpret LoAF reports is key to improving your site’s performance.

Step-by-Step Guide to Reading LoAF Reports

When you open a LoAF report, you’ll typically see several key metrics that describe what happened during the animation frame. Here is an illustration of how the sequence for rendering a frame breaks down:

Illustration of a frame sequence LoAF report
  1. The startTime marks when the previous frame has completed, and the browser starts working on the current frame.
  2. The duration shows how long the frame took in milliseconds from startTime until the frame is displayed to the user. Any duration over 50 milliseconds will be reported as a Long Animation Frame.
  3. During the frame, there may be a firstUIEvent, such as a click or keystroke. These are user interactions that need to be handled before the browser can render the frame. There may not be any events during a frame.
  4. Once all UIEvents have been handled, the browser begins the update the rendering phase, marked as renderStart.
  5. After the browser knows what to render, styleAndLayoutStart occurs, where layout calculations are made.
  6. Scripts can run at various points during the frame, or not at all. How scripts are invoked and when they execute can impact the frame in different ways:
    • When a script finishes downloading, it must be parsed and compiled. This work shows up in a LoAF when the invoker is the script’s URL and invokerType is “classic-script” or “module-script,” depending on how it was loaded.
    • A script may be queued from a previous frame, such as a callback to setInterval or setTimeout. These scripts will show an invoker like TimerHandler:setTimeout.
    • Scripts that run after firstUIEvent may be triggered by event listeners, with invokerType as event-listener and a descriptive invoker like DIV#main.onclick.
    • Scripts running during the render and layout phases can be especially problematic if they are slow. JavaScript handlers to requestAnimationFrame run after renderStart, while resizeObserver handlers fire after styleAndLayoutStart.

That’s a lot of details, so let’s dive into some specific examples:

Example Long Animation Frame Reports

1. Compiling and executing a large script

When JavaScript is included on a page via a <script> tag, it has to be downloaded, compiled, and executed. For large and complex scripts, this process can take time. Consider this LoAF report:

{
  "blockingDuration": 0,
  "duration": 91,
  "entryType": "long-animation-frame",
  "firstUIEventTimestamp": 0,
  "name": "long-animation-frame",
  "renderStart": 670,
  "scripts": [
    {
      "duration": 55,
      "entryType": "script",
      "executionStart": 615,
      "forcedStyleAndLayoutDuration": 0,
      "invoker": "https://example.com/script.js",
      "invokerType": "classic-script",
      "name": "script",
      "pauseDuration": 0,
      "sourceURL": "https://example.com/script.js",
      "sourceFunctionName": "",
      "sourceCharPosition": 0,
      "startTime": 612,
      "window": [Window object],
      "windowAttribution": "self"
    }
  ],
  "startTime": 607,
  "styleAndLayoutStart": 670
}
Long Animation Frame report for a single large script

Here’s how this would look in a flame chart:

Illustration of a LoAF report with a single large script

In this example, an animation frame starts at 607 milliseconds after the page load. During this frame, the script script.js finishes downloading and begins parsing at 612 ms. The script runs for 55 milliseconds, which delays the browser’s ability to start rendering until 670 ms, making this a Long Animation Frame.

2. Slow event handlers

Many Long Animation Frames are caused by slow event handlers. When a user clicks a button, the associated JavaScript handler needs to respond promptly. Consider this LoAF report:

{
  "blockingDuration": 0,
  "duration": 103,
  "entryType": "long-animation-frame",
  "firstUIEventTimestamp": 5913,
  "name": "long-animation-frame",
  "renderStart": 5998,
  "scripts": [
    {
      "duration": 84,
      "entryType": "script",
      "executionStart": 5914,
      "forcedStyleAndLayoutDuration": 0,
      "invoker": "button#submit.onclick",
      "invokerType": "event-listener",
      "name": "script",
      "pauseDuration": 0,
      "sourceURL": "https://example.com/script.js",
      "sourceFunctionName": "onSubmit",
      "sourceCharPosition": 2347,
      "startTime": 5914,
      "window": [Window object],
      "windowAttribution": "self"
    }
  ],
  "startTime": 5902,
  "styleAndLayoutStart": 5998
}
Long Animation Frame report for a slow event handler

Here’s how that might look in a flame chart:

Illustration of a LoAF report with a single large script

Here we have an animation frame that starts at 5902 milliseconds after page load. During this frame, the user clicks on a submit button, triggering the handler onSubmit(). That function is slow and executes for 84 milliseconds, which blocks the main thread and pushes the render cycle out until 5998 ms.

3. LoAF without Script information

Sometimes, you’ll get a Long Animation Frame report with limited information about the scripts running. This can happen when the scripts running are from cross-origin locations. You may be able to get more information if the scripts are decorated with the crossorigin="anonymous" attribute, but this can also break the script if it is not served with appropriate Cross-Origin headers.

4. LoAF without any Scripts

Long Animation Frames often get reported without any scripts at all. Consider this report:

{
  "blockingDuration": 0,
  "duration": 85,
  "entryType": "long-animation-frame",
  "firstUIEventTimestamp": 0,
  "name": "long-animation-frame",
  "renderStart": 9873,
  "scripts": [],
  "startTime": 9792,
  "styleAndLayoutStart": 9873
}
Long Animation Frame report with no scripts

The frame started at 9792 milliseconds after load (about 10 seconds), but froze for 85 milliseconds for some reason. This kind of LoAF report is not very actionable, as we don’t have any evidence other than it was slow. It could have been:

  • A non-JavaScript resource being downloaded
  • Complex markup or layout changes
  • External factors unrelated to the browser

So what do you do about it? I don’t know. Seems like noise to me.

Go make some butter toast and ignore it.

5. LoAF Before First Contentful Paint (FCP)

Sometimes, Long Animation Frames can be reported before the First Contentful Paint (FCP) event has happened. Before FCP, the user is seeing a blank page, so there is nothing to interact with. This can be caused by large scripts, large resources, or complicated DOM structures.

Generally, if your FCP is less than 800 milliseconds, which Google considers good, then you don’t need to worry about Long Animation Frames during this period

Analyzing LoAF with RUM tools

There’s a lot going on in a LoAF report, especially if you are trying to analyze thousands of reports from your real users. Tools like Request Metrics break down your Long Animation Frames, show you a breakdown of your LoAF time, the most common scripts involved, and how they get invoked.

Long Animation Frames and Scripts in Request Metrics

In this screenshot, we can see that there are several 500 millisecond or greater Long Animation Frames, usually caused by inline scripts on the root page. Check out more of what Request Metrics can do with LoAF reports.

How to Fix Long Animation Frames

Fixing Long Animation Frames (LoAFs) requires a mix of identifying common causes and applying specific optimization techniques. The goal is to ensure smooth, responsive interactions while reducing the strain on the browser’s rendering pipeline. Let’s break down how you can address LoAFs and improve your site’s performance.

Common causes of LoAFs

Other than bakers, here are the main culprits of long animation frames:

  • Long JavaScript Execution - Long-running JavaScript tasks block the main thread, preventing the browser from rendering the next frame on time. This can happen when event handlers, timers, or other JavaScript functions do too much work at once. Worse, when multiple tasks pile up within the same frame, the browser may struggle to process them all in the given time, resulting in a LoAF.

  • Large JavaScript Files - Every JavaScript file need to be parsed, compiled, and executed once it’s been downloaded, and this work blocks the main thread during rendering. When a JavaScript file is particularly large or complex, the browser’s processing of it can cause delays, making it difficult to maintain a smooth animation flow.

  • Forced Synchronous Layouts - Changes to the DOM that trigger layout recalculations (like resizing elements, modifying their position, or changing dimensions with JavaScript) can cause significant delays. These recalculations, known as forced synchronous layouts, make the browser perform reflows and repaints that can easily delay frame rendering and cause LoAFs.

Now we’re ready to toast some LoAFs! Let’s look at specific tactics that you can use to fix these problems and optimize your site’s performance.

Optimizing JavaScript Execution

1. Break up long tasks

JavaScript that does too much work at once is a major cause of Long Animation Frames (LoAFs). To fix this, you can break long-running tasks into smaller chunks and distribute them across multiple frames. Use setTimeout or similar techniques to spread out non-urgent work so it doesn’t block rendering.

For example, consider this function that performs some heavy work by counting to a million:

function heavyTask() {
  let countString = "";

  for(let i = 1; i < 1000000; i++) {
    countString += `${i}, `;
  }

  return countString;
}
Heavy Task that counts to 1 million

This code will block the main thread for quite some time, as it counts to a million all in one go. We can refactor this to process the work in chunks, allowing the browser to handle other tasks—like rendering frames—between chunks.

Here’s the updated code that spreads the work over multiple frames:

function heavyTask() {
  let countString = "";

  function processChunk(start) {
    const chunkEnd = start + 1000;
    for(let i = start; i < 1000000 && i < chunkEnd; i++) {
      countString += `${i}, `;
    }
    setTimeout(() => processChunk(chunkEnd), 0);
  }

  processChunk(0);
}
Heavy Task that counts to 1 million in chunks of 1000

This version processes the counting in batches of 1000 numbers at a time, returning control to the browser between each chunk. By doing this, you avoid blocking the main thread and prevent any Long Animation Frames from occurring.

Calling setTimeout returns control to the browser, and adds your task to the end of the waiting queue. There is no guarantee that your function will be run in the timeframe you specified. To address this concern, the Google team is trialing a new API called scheduler.yield, which adds your task to the front of the waiting queue, so you have more control on when your task resumes.

2. Minimize work inside requestAnimationFrame

requestAnimationFrame callbacks are invoked just before the browser renders the next frame, so they need to be fast. The purpose of requestAnimationFrame is to make final adjustments to the DOM for the upcoming frame—not to handle extensive processing tasks.

Using requestAnimationFrame as a timing mechanism can be useful because it’s called right before rendering. You can use it to defer lightweight DOM changes until the last moment, ensuring the frame is rendered quickly, while offloading heavier tasks to the next frame.

Here’s an example of how to handle a button click efficiently:

button.addEventListener('click', () => {
  requestAnimationFrame(() => {
    // Quick DOM update in the frame
    button.setAttribute('disabled', 'disabled');

    // Defer the heavy work to the next frame
    setTimeout(processTheClick, 0);
  });
});
Using requestAnimationFrame efficiently

This code that handles the user clicking a button uses the next frame only to disable the button, then defers all the future work to processTheClick until the next frame.

In this example, the button is disabled during the next frame using requestAnimationFrame, but the actual processing (processTheClick) is deferred using setTimeout so that the heavy lifting happens after the frame is rendered.

3. Avoid work in ResizeObserver and IntersectionObserver

Just like requestAnimationFrame, callbacks to ResizeObserver and IntersectionObserver happen just before the paint event. They exist to give you the ability to respond to a window resize or an element scrolling into view, but it’s dangerous to do too much work here. Doing too much work can result in JavaScript Errors.

Unless your intention is to stop the next frame from happening, it’s a good idea to defer most of the work until the next frame, like this:

new ResizeObserver((entries) => {
  setTimeout(() => {
    dealWithEntries(entries);
  }, 0);
});
Minimizing work in ResizeObserver

In this example, we’re using setTimeout to push the actual work to the next frame, allowing the browser to complete its current rendering without delay.

Reducing the impact of large JavaScript files

Large JavaScript files can be a major contributor to Long Animation Frames (LoAFs). When a browser encounters a large JavaScript file, it needs to parse, compile, and execute the file, which can block the main thread and delay frame rendering. Here are some strategies to reduce the impact of large JavaScript files:

1. Code-Splitting

Code-splitting is the process of breaking down a large JavaScript bundle into smaller, more manageable chunks that can be loaded on demand. This allows the browser to load only the JavaScript needed for the current page or interaction, rather than downloading everything upfront.

Modern bundlers like Webpack, Rollup, and Parcel offer built-in support for code-splitting. By loading modules or chunks only when needed, you prevent the browser from overloading the main thread with unnecessary code during critical rendering moments, leading to smoother animations and better performance.

2. Defer JavaScript parsing and execution

Most JavaScript isn’t required immediately when the page loads (or at least it shouldn’t be). You can use the defer attribute to delay the parsing and execution of scripts until your page’s main content is fully loaded. This ensures that non-critical JavaScript files don’t block the browser’s main thread during the rendering process.

<script src="scripts.js" defer></script>
Script defer attribute

Deferred scripts will be parsed, compiled, and executed just before the DOMContentLoaded event. You can further reduce the impact by wrapping your scripts in a deferred event listener:

window.addEventListener("DOMContentLoaded", () => {
  setTimeout(() => {
    //start your script
  }, 0);
});
Nested defer inside DOMContentLoaded

This method allows the structure of your script to be parsed, but yields the main thread to allow other scripts or tasks to complete before execution begins. Deferring scripts helps reduce the likelihood of LoAFs impacting critical animations or interactions.

Remove Forced Synchronous Layouts

One of the slowest things a browser can do is a forced synchronous layout. This is when we change something in the DOM, such as applying a class, then read the properties of the DOM.

Consider this function:

function bigButtons() {
  button.classList.add("big");
  console.log(button.offsetWidth);
}
Function to make buttons big and log the new width

The first line adds a class to a button, which queues up for the browser’s next render cycle. But then, we try to read the offsetWidth of the button. It might be out of date with this new class applied, so it forces the browser to stop what it’s doing and update the layout, right now.

Removing these forced layouts is key to avoiding janky animations and maintaining a smooth, responsive user experience. Here’s how to do it:

1. Batch DOM Updates

Forced synchronous layouts occur when you write to and then immediately read from the DOM. Each time you query a DOM property like offsetWidth or scrollHeight, the browser may need to recalculate the current layout.

To prevent this, batch your DOM reads and writes. First, collect all the DOM measurements you need, then apply your changes afterward. This ensures the browser only recalculates the layout once, minimizing the performance impact.

For example:

const width = element.offsetWidth;
const height = element.offsetHeight;

element.style.width = width + '10px';
element.style.height = height + '10px';
Reading then writing DOM updates

By separating the DOM reads and writes, you prevent the browser from recalculating the layout multiple times within the same frame, reducing the chance of triggering a LoAF.

2. Avoid Layout Thrashing

You know what’s worse than a forced synchronous layout? Doing it over and over again! This is called layout thrashing—when JavaScript repeatedly reads from and writes to the DOM in quick succession, often in a loop. This forces the browser to recalculate the layout over and over again within a single frame, causing severe performance issues.

To avoid layout thrashing, separate DOM measurements from DOM modifications, and make sure you’re not causing multiple reflows by reading from the DOM inside a loop.

Here’s an example of how layout thrashing happens and how to fix it:

// Bad: Causes layout thrashing by reading and writing in a loop
for (let i = 0; i < elements.length; i++) {
  elements[i].style.width = elements[i].offsetWidth + 'px';
}

// Good: Batch the DOM reads, then the writes
const widths = [];
for (let i = 0; i < elements.length; i++) {
  widths[i] = elements[i].offsetWidth;
}
for (let i = 0; i < elements.length; i++) {
  elements[i].style.width = widths[i] + 'px';
}
Example of Layout Thrashing

By batching DOM reads and writes, you ensure the browser only recalculates the layout once, greatly improving performance and reducing the chance of LoAFs.

3. Use transform for Animations

When animating elements, avoid changing properties that trigger layout recalculations, such as width, height, left, top, or margin. These types of properties force the browser to reflow the entire layout. Instead, use properties like transform, which are handled by the compositing layer and don’t affect layout calculations.

For example, if you want to enlarge an element when the user hovers over it, use transform:

.element {
  transition: transform 200ms ease-out;
}

.element:hover {
  transform: scale(1.2);
}
CSS Animations with Transform

By using transform for animations, you can avoid triggering expensive reflows and repaints, which significantly reduces the risk of LoAFs. Additionally, this is a great way to optimize animations for mobile devices. Transform makes for smooth animations with reduced jank.

Single Page Applications and Long Animation Frames

A lot of modern web applications are built as Single Page Applications (SPAs) or Progressive Web Applications (PWAs), which rely heavily on JavaScript and animations to provide dynamic, fluid user experiences. SPAs and PWAs are powerful for creating responsive and interactive web apps, but they also come with their own performance pitfalls—especially when it comes to Long Animation Frames (LoAFs).

SPAs typically manage a significant amount of client-side rendering, meaning JavaScript is responsible for handling UI updates, transitions, and routing, often without reloading the entire page. While this creates a smoother experience for users, it also means there’s more opportunity for heavy JavaScript execution, repeated layout recalculations, and blocking tasks to stack up and trigger LoAFs.

Common LoAF Challenges in SPAs

  • Complex Component Rendering: In frameworks like React, Angular, and Vue, components may trigger multiple re-renders within the same frame, leading to layout thrashing or forced synchronous layouts.

  • State Management: SPAs often rely on global state management libraries like Redux or Vuex, which can cause additional computation and state reactivity that might block the rendering pipeline.

  • Animations and Transitions: SPAs tend to include a lot of page transitions or UI animations, which, if not optimized properly, can result in janky or slow animations, leading to noticeable LoAFs.

Tactics for Reducing LoAFs in SPAs

  1. Optimize Component Updates: Frameworks like React and Vue offer ways to optimize rendering. Use memoization (React.memo, useMemo) or the shouldComponentUpdate method to avoid unnecessary re-renders of components that don’t need to change.

  2. Defer Non-Critical JavaScript: Use code-splitting or dynamic imports to load JavaScript modules only when they’re needed, rather than loading all of your app’s code at once.

  3. Use requestIdleCallback: SPAs often handle tasks like data fetching or state updates. Using requestIdleCallback allows you to queue non-urgent work when the browser has idle time, minimizing the chance of LoAFs impacting animations.

By understanding the unique challenges SPAs face in managing JavaScript-heavy workloads and animations, developers can take targeted steps to ensure smooth performance and reduce animation jank in Single Page Applications.

Tools to Help Identify and Fix LoAFs

Tracking and fixing Long Animation Frames (LoAFs) can be tricky, especially when dealing with complex web applications. Fortunately, there are several powerful tools available to help you identify LoAFs, analyze their causes, and ultimately fix the performance issues that lead to them.

1. Chrome DevTools

Chrome DevTools is an essential tool for every web developer, and while it doesn’t currently expose LoAFs by default, you can use its Performance Panel to get a detailed breakdown of your site’s frame rendering. By analyzing long tasks, resource loading, and paint events, you can infer when LoAFs are happening and diagnose what’s causing them.

For LoAF-specific tracking, you can extend Chrome DevTools using the Performance API to log and measure LoAFs directly in the timeline. This can be done using a custom DevTools extension or by adding LoAF entries to the timeline via PerformanceObserver.

2. Request Metrics

Request Metrics offers built-in support for LoAF reports, making it easy to track Long Animation Frames from real users and get detailed, actionable insights. Request Metrics gives you:

  • A breakdown of which pages and scripts are causing LoAFs.
  • Real-time data from real users (field data) to identify LoAFs under real-world conditions.
  • Performance insights into interaction delays, animation jank, and other Core Web Vitals metrics like INP (Interaction to Next Paint).
LoAF report inline a loading waterfall on Request Metrics

The ability to track LoAFs from Real User Monitoring (RUM) in Request Metrics helps ensure you’re seeing the real impact of performance issues on your users.

3. Web Vitals Extension

The Web Vitals Extension from Chrome provides lots of valuable performance information about your current session, including Long Animation Frames. It reports the Core Web Vitals, including any LoAF reports that impact your Interaction to Next Paint (INP) scores.

LoAF report in console of Web Vitals extension

The Last Slice of the LoAF

Toasting Long Animation Frames (LoAFs) isn’t just about making your website run faster—it’s about delivering a smoother, more responsive experience that keeps users engaged and happy. By reducing animation jank and optimizing your site’s performance, you’re ensuring that users can interact with your content seamlessly, without frustrating delays.

Whether you’re dealing with heavy JavaScript execution, forced synchronous layouts, or unoptimized animations, the key to solving LoAFs is identifying the root causes and applying targeted solutions. Tools like Request Metrics, Chrome DevTools, and the Web Vitals Extension make it easier than ever to track LoAFs, analyze their impact, and take action to fix them.

Web Performance is essential. So slice off the jank, butter your animations with care, and serve up a website that’s as smooth as it is fast. Happy toasting!

Todd H. Gardner
CEO Request Metrics

Todd is a software engineer, business leader, and developer advocate with 20+ years of experience. He is a co-founder and CEO of TrackJS and Request Metrics, and previously a independent consultant who helped build products at Thomson Reuters, Reach Local, and LeadPages.