Improving Your Interaction to Next Paint (INP)
Interaction to Next Paint (INP) is the newest addition to Google’s Core Web Vital metrics. It measures how real users perceive the responsiveness of modern websites. Responsiveness metrics like INP are becoming increasingly important as websites run more and more JavaScript.
On March 12, 2024, INP will replace FID as a Core Web Vital metric, and begin influencing the pagerank of websites. Be sure to get yours fast before then to prevent SEO problems.
What is Interaction To Next Paint?
Every user interaction causes the browser to do work. The more work that is done, the longer it will take for the browser to “paint” or update what is displayed on the screen. This delay is called Interaction to Next Paint (INP). When a user interacts with the page many times, the slowest interaction becomes the INP score for that page.
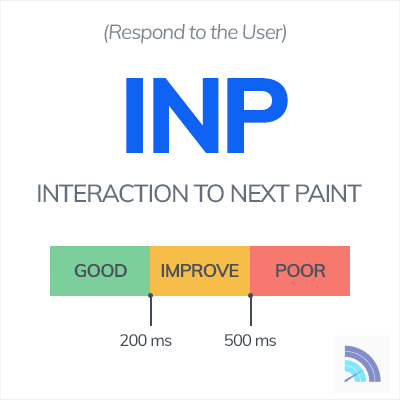
Interaction to Next Paint differs for every application. Google has provided guidance on good INP times:
How to measure INP?
You won’t see INP in Chrome Lighthouse or Pagespeed Insights as they are synthetic testing tools, and don’t actually interact with the pages they are testing. The best way to capture INP data is from real user monitoring tools, like Request Metrics.
Real User Monitoring tools will collect INP data from the real users that visit your website, and rollup that data into meaningful reports. It’s based on the same data that Google uses to decide whether your website has a performance issue.

In this case, the website has an INP issue because the 75% worst users for INP is more than then 200 ms limit Google has specified.
Measuring INP With JavaScript
If you prefer to Do It Yourself™, INP is returned using the PerformanceObserver API exposed by the browser. It is not a singular value, but a value calculated over the lifetime of the page:
var currentInp = -1;
new PerformanceObserver((entryList) => {
    entryList.getEntries().forEach((entry) => {
        if (!entry.interactionId) { return; }

        if (entry.duration > currentInp) {
            currentInp = entry.duration;
            console.log(`New INP value: ${currentInp}ms`);
            // Output:
            //   New INP value: 312ms
        }
    });
}).observe({ type: "event", buffered: true, durationThreshold: 0 });
Note that the INP calculation in this example is not exactly correct (See INP Quirks), but is included for a basic understanding of how INP works.
Google maintains a web-vitals library that does a lot of the dirty work for you. Using their library is a more dependable solution than rolling your own measurement. The library measures correctly, handles browser quirks and is updated as the INP specification changes.
<script src="https://unpkg.com/web-vitals@3/dist/web-vitals.iife.js"></script>
<script>
    webVitals.onINP(
        metric => console.log(`New INP Value: ${metric.value}ms`),
        { reportAllChanges: true }
    );
    // Output:
    //    New INP Value: 120ms
</script>
Passing the reportAllChanges option tells the web-vitals library to notify every time the INP value changes. By default, the library only runs the callback after a page is unloaded or loses focus.
What Causes Poor INP?
Heavy JavaScript is the main cause of long interaction to next paint times. Both initial script parsing and script execution can be culprits. Very rarely, CSS or DOM size can cause long interaction delays as well.
INP is related to Long Animation Frames (LoAF), which also measure freezes in user interactivity.
1. Long Running Event Handlers
Event handlers block page rendering and increase INP time as a result. INP times increase when too much synchronous work is done in event handlers. This can be improved by removing unnecessary work from event handlers. If the work can be done later, the event handler can run the code asynchronously after the page has rendered a new frame.
2. Long Running JavaScript
Long INP times occur even when all JavaScript has been loaded and there are no long running event handlers. Any long running task in JavaScript runs on the main thread. User inputs are blocked until the task finishes and the main thread is free to handle the input. Any poorly optimized code can cause this issue. JS frameworks like React and Angular are often culprits when coding mistakes cause excessive re-rendering.
3. Heavy Upfront JavaScript Payloads
Large JavaScript bundles can take a long time for the browser to parse and evaluate. Inputs during page load are delayed because they must wait for the page to load all referenced JavaScript. Large bundles are often caused by excessive third party dependencies or the inclusion of code that is not needed by the current page. A user interaction that occurs during script loading will have a high INP time because the browser must wait for all scripts to finish before handling the user input.
How to Improve INP
Interaction to Next Paint times encompasses three main browser phases: input delay, event handlers and presentation/rendering. Each of these phases have their own behaviors and reasons for being slow. Identifying the slow phase is the first step to optimizing INP.
1. Input Delay
User interaction handling happens on the the page’s main thread. Anything else running on it will delay execution and handling of the interaction. As soon as the main thread is available, the browser will begin handling the event (Phase #2). This phase is unique because it is more commonly a problem when the page is still loading assets and scripts.
The browser cannot begin handling until all scripts on the page are downloaded and interpreted. Large JavaScript bundles will block all user interaction until the browser has finished loading them. Script load time can be improved by breaking up script bundles and avoiding scripts that are not needed.
JavaScript must always run on the main thread. Long running scripts will use the main thread until they are finished, blocking handling of user inputs in the process. This can be resolved by either breaking up long running code into smaller parts, deferring work to a later time, or avoiding calls to the code all together.
2. Event Handling
The browser begins running event handlers/callbacks when it has control of the main thread. This marks the beginning of the second phase. Poor performance in this phase is almost entirely the result of slow or poorly written JavaScript event callbacks. The browser cannot begin rendering the page (Phase #3) until all callbacks have finished running.
Event handler performance is best improved by avoid all unnecessary work. Some work just can’t be avoided however. In those cases, heavy JavaScript should be deferred until after the event handler is finished.
Event handlers may be slow because they are causing layout thrashing. Layout thrashing occurs when JavaScript accesses properties and methods that require style or layout recalculation. There are many properties that force layout/reflows, but a simple example is calling elem.getBoundingClientRect() on a DOM element. The browser must compute exactly where the element is and what size it is which requires recalculating the entire page layout, blocking the event handler until finished.
3. Presentation Delay
The browser still needs to re-paint (or re-render) the page after all event handlers have finished. If the DOM is changed as a result of the user interaction, the page layout may need to be recalculated. All this layout and painting work takes time, often referred to as presentation delay.
This delay gets longer as the DOM gets larger and more complex. Complex CSS and styles with inefficient selectors also contribute to the page’s presentation delay. Reduce the size and complexity of the DOM and optimize CSS styles to improve long paint times.
Which User Interactions Does INP Measure?
Not all user interactions are included in INP measurements. Hovers, scrolls and related events are ignored completely. Only three types of user interactions are considered:
- Mouse Clicks
- Touchscreen Taps
- Key presses
What is a Good INP Time?
Google has defined what it believes are good ranges for a page’s INP:
- Good: less than 200ms
- Needs Improvement: between 200 and 500ms
- Bad: greater than 500ms
How is INP Different than FID?
Interaction to Next Paint measures user interaction times similar to First Input Delay, but has some important differences.
INP Measures All Interactions
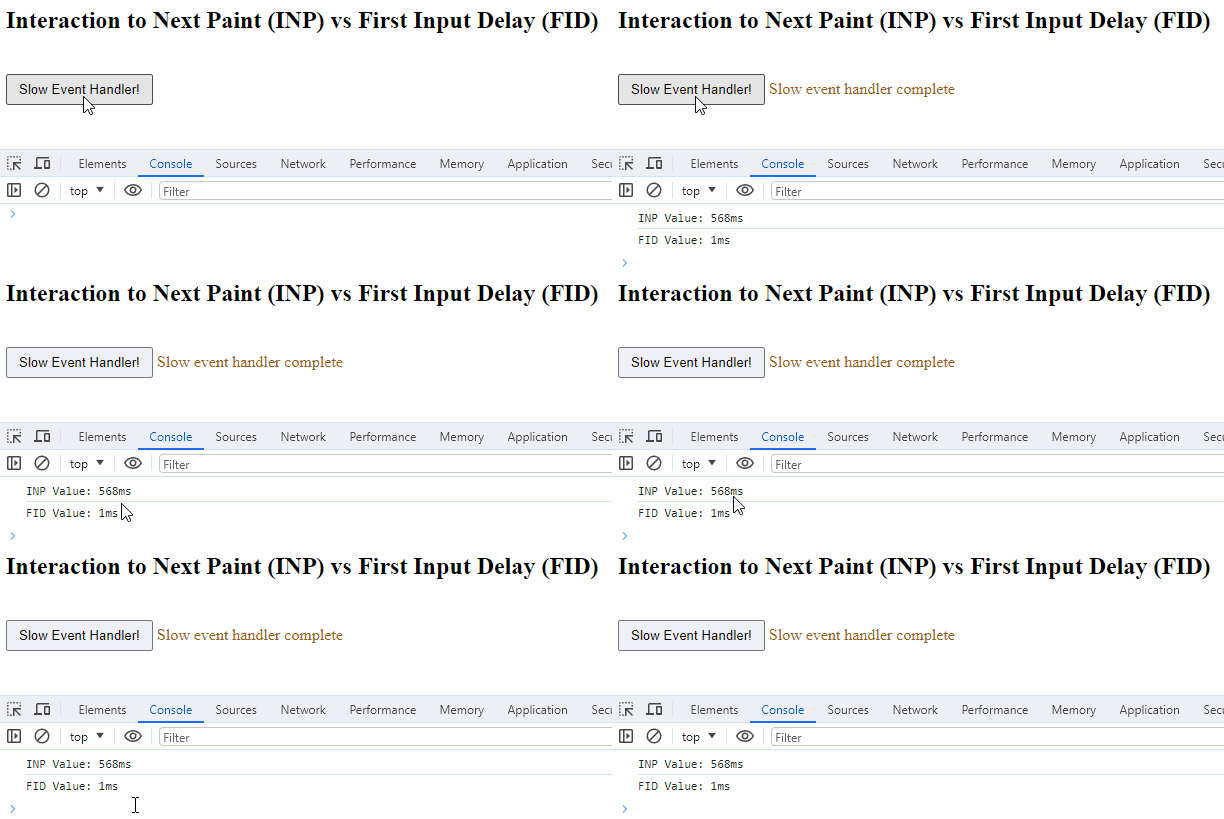
INP reports the worst time of all user interactions on the page while FID only reports a timing for the first user interaction.
INP Time Includes Event Handlers
FID reflects the duration from user interaction to the moment the first event handler begins running. INP times include the completion of all event handlers and anything else that blocks the next frame paint.
Interaction to Next Paint Quirks and Details
While INP can be summarized pretty quickly, there are a number of details and quirks in the measurement.
(Usually) The Slowest Interaction
INP is the slowest interaction on the page except when there are a very large number of user interactions. INP is defined as the 98th percentile duration to next paint. Said another way, one large outlier is thrown away for every 50 interactions. In practice, a page’s INP is the slowest interaction because pages rarely have more than 50 interactions.
INP Is Per Interaction, Not Event Handler
One user interaction may trigger many event handlers. Click triggers pointerdown, pointerup and click for example. If each of these three handlers took 50ms to complete, then the INP for that interaction would be at least 150ms.
Fast Interactions Round to Zero
By default, INP measurements ignore interactions with durations under 40ms. Because these interactions are not considered, a page with only fast interactions will have an INP score of zero. Note that this is implementation dependent, and can be overridden if needed.
The Page Doesn’t Need to Change
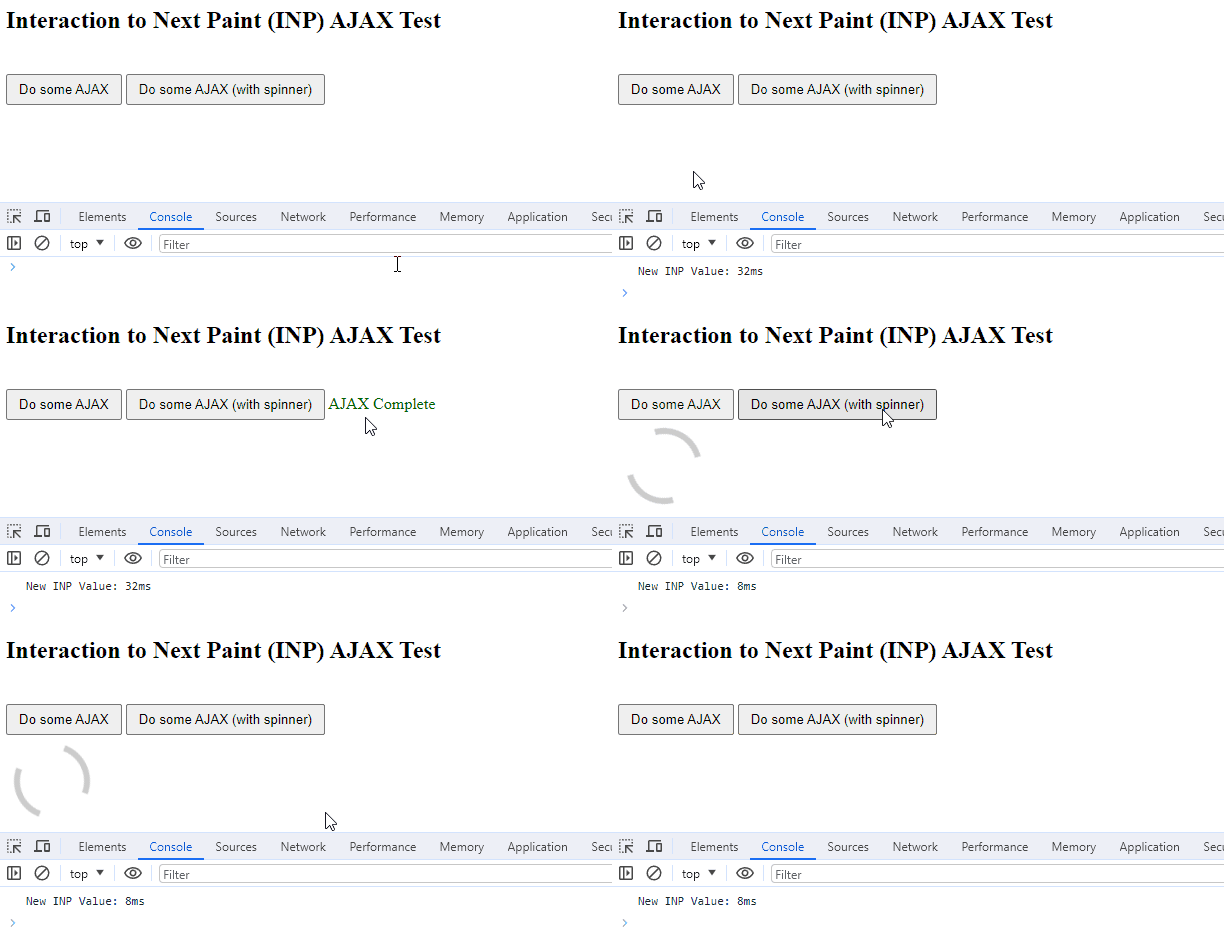
INP measures time to the next frame render, regardless of whether that frame is different from the last. Adding a visual indicator to the page will not influence Interaction to Next Paint times in any meaningful way. This example makes a two second long AJAX call, INP is virtually the same with or without a progress spinner:
Interaction to Next Paint Does Not Always Occur
Not every page view results in an INP measurement. If the user never interacts with the page, no INP time can be calculated.
Next Step: Start measuring your INP with Request Metrics
Now that you understand INP and its impact, find out what your users in production are actually experiencing! Request Metrics monitors your application’s INP as experienced by your actual users, and gives you tips to make it faster.


