
Fixing Long Animation Frames (LoAF)
You’ve found some Long Animation Frames (LoAFs) impacting your site, now you need to fix them! LoAFs can make animations feel sluggish, delay user interactions, and generally reduce your site’s responsiveness, all of which contribute to a frustrating experience for users. Fortunately, by analyzing LoAF data and addressing common performance bottlenecks, you can dramatically improve how smoothly your site runs.
In this guide, we’ll walk through the tools and techniques for analyzing LoAF data and provide a series of actionable tactics to reduce these slow frames. We’ll cover everything from interpreting LoAF reports to specific optimizations for JavaScript execution, large assets, and layout calculations.
Whether your site relies on animations for visual polish or key user interactions, optimizing for LoAFs is essential to ensuring a fast, engaging experience that keeps users coming back. Let’s get started with understanding the structure of LoAF reports, so you can make informed decisions about where to focus your efforts.
Analyzing LoAF Data
Once you’ve captured Long Animation Frames (LoAFs) from the API or your Real User Monitoring tool, it’s time to dig into the data and make it actionable. Whether you’re viewing the data in a dashboard like Request Metrics or through other tools, understanding how to read and interpret LoAF reports is key to improving your site’s performance.
Step-by-Step Guide to Reading LoAF Reports
When you open a LoAF report, you’ll typically see several key metrics that describe what happened during the animation frame. Here is an illustration of how the sequence for rendering a frame breaks down:
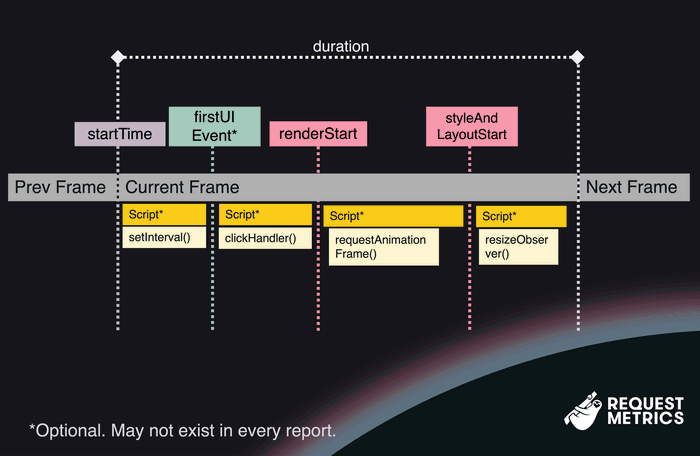
- The startTime marks when the previous frame has completed, and the browser starts working on the current frame.
- The duration shows how long the frame took in milliseconds from startTime until the frame is displayed to the user. Any duration over 50 milliseconds will be reported as a Long Animation Frame.
- During the frame, there may be a firstUIEvent, such as a click or keystroke. These are user interactions that need to be handled before the browser can render the frame. There may not be any events during a frame.
- Once all UIEvents have been handled, the browser begins the update the rendering phase, marked as renderStart.
- After the browser knows what to render, styleAndLayoutStart occurs, where layout calculations are made.
- Scripts can run at various points during the frame, or not at all. How scripts are invoked and when they execute can impact the frame in different ways:
- When a script finishes downloading, it must be parsed and compiled. This work shows up in a LoAF when the invoker is the script’s URL and invokerType is “classic-script” or “module-script,” depending on how it was loaded.
- A script may be queued from a previous frame, such as a callback to setInterval or setTimeout. These scripts will show an invoker like TimerHandler:setTimeout.
- Scripts that run after firstUIEvent may be triggered by event listeners, with invokerType as event-listener and a descriptive invoker like DIV#main.onclick.
- Scripts running during the render and layout phases can be especially problematic if they are slow. JavaScript handlers to requestAnimationFrame run after renderStart, while resizeObserver handlers fire after styleAndLayoutStart.
That’s a lot of details, so let’s dive into some specific examples:
Example Long Animation Frame Reports
1. Compiling and executing a large script
When JavaScript is included on a page via a <script> tag, it has to be downloaded, compiled, and executed. For large and complex scripts, this process can take time. Consider this LoAF report:
{
  "blockingDuration": 0,
  "duration": 91,
  "entryType": "long-animation-frame",
  "firstUIEventTimestamp": 0,
  "name": "long-animation-frame",
  "renderStart": 670,
  "scripts": [
    {
      "duration": 55,
      "entryType": "script",
      "executionStart": 615,
      "forcedStyleAndLayoutDuration": 0,
      "invoker": "https://example.com/script.js",
      "invokerType": "classic-script",
      "name": "script",
      "pauseDuration": 0,
      "sourceURL": "https://example.com/script.js",
      "sourceFunctionName": "",
      "sourceCharPosition": 0,
      "startTime": 612,
      "window": [Window object],
      "windowAttribution": "self"
    }
  ],
  "startTime": 607,
  "styleAndLayoutStart": 670
}Here’s how this would look in a flame chart:
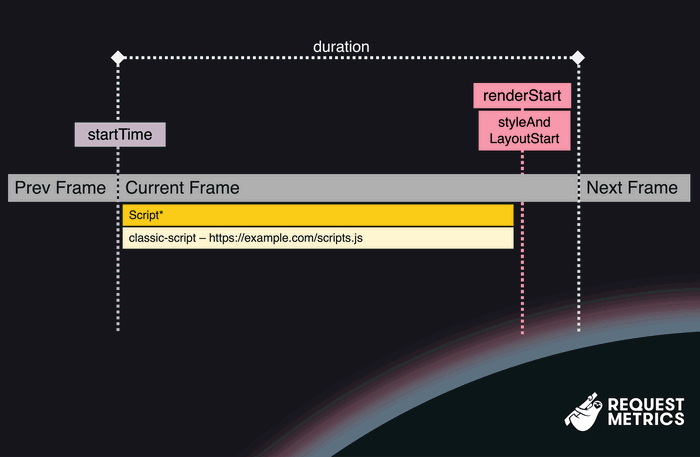
In this example, an animation frame starts at 607 milliseconds after the page load. During this frame, the script script.js finishes downloading and begins parsing at 612 ms. The script runs for 55 milliseconds, which delays the browser’s ability to start rendering until 670 ms, making this a Long Animation Frame.
2. Slow event handlers
Many Long Animation Frames are caused by slow event handlers. When a user clicks a button, the associated JavaScript handler needs to respond promptly. Consider this LoAF report:
{
  "blockingDuration": 0,
  "duration": 103,
  "entryType": "long-animation-frame",
  "firstUIEventTimestamp": 5913,
  "name": "long-animation-frame",
  "renderStart": 5998,
  "scripts": [
    {
      "duration": 84,
      "entryType": "script",
      "executionStart": 5914,
      "forcedStyleAndLayoutDuration": 0,
      "invoker": "button#submit.onclick",
      "invokerType": "event-listener",
      "name": "script",
      "pauseDuration": 0,
      "sourceURL": "https://example.com/script.js",
      "sourceFunctionName": "onSubmit",
      "sourceCharPosition": 2347,
      "startTime": 5914,
      "window": [Window object],
      "windowAttribution": "self"
    }
  ],
  "startTime": 5902,
  "styleAndLayoutStart": 5998
}Here’s how that might look in a flame chart:
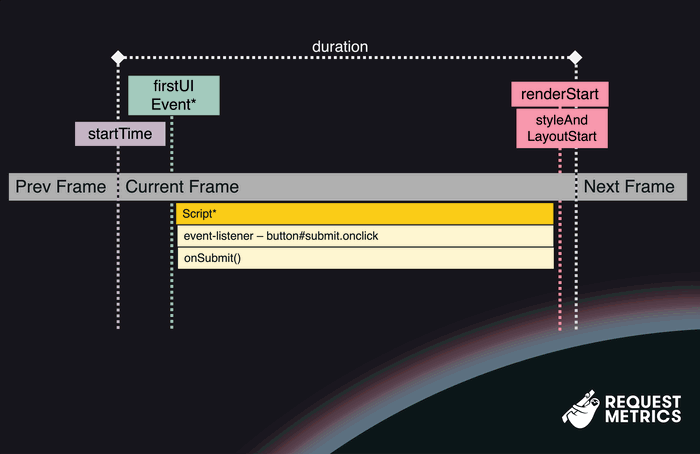
Here we have an animation frame that starts at 5902 milliseconds after page load. During this frame, the user clicks on a submit button, triggering the handler onSubmit(). That function is slow and executes for 84 milliseconds, which blocks the main thread and pushes the render cycle out until 5998 ms.
3. LoAF without Script information
Sometimes, you’ll get a Long Animation Frame report with limited information about the scripts running. This can happen when the scripts running are from cross-origin locations. You may be able to get more information if the scripts are decorated with the crossorigin="anonymous" attribute, but this can also break the script if it is not served with appropriate Cross-Origin headers.
4. LoAF without any Scripts
Long Animation Frames often get reported without any scripts at all. Consider this report:
{
  "blockingDuration": 0,
  "duration": 85,
  "entryType": "long-animation-frame",
  "firstUIEventTimestamp": 0,
  "name": "long-animation-frame",
  "renderStart": 9873,
  "scripts": [],
  "startTime": 9792,
  "styleAndLayoutStart": 9873
}The frame started at 9792 milliseconds after load (about 10 seconds), but froze for 85 milliseconds for some reason. This kind of LoAF report is not very actionable, as we don’t have any evidence other than it was slow. It could have been:
- A non-JavaScript resource being downloaded
- Complex markup or layout changes
- External factors unrelated to the browser
So what do you do about it? I don’t know. Seems like noise to me.
Go make some butter toast and ignore it.
5. LoAF Before First Contentful Paint (FCP)
Sometimes, Long Animation Frames can be reported before the First Contentful Paint (FCP) event has happened. Before FCP, the user is seeing a blank page, so there is nothing to interact with. This can be caused by large scripts, large resources, or complicated DOM structures.
Generally, if your FCP is less than 800 milliseconds, which Google considers good, then you don’t need to worry about Long Animation Frames during this period
Analyzing LoAF with RUM tools
There’s a lot going on in a LoAF report, especially if you are trying to analyze thousands of reports from your real users. Tools like Request Metrics break down your Long Animation Frames, show you a breakdown of your LoAF time, the most common scripts involved, and how they get invoked.
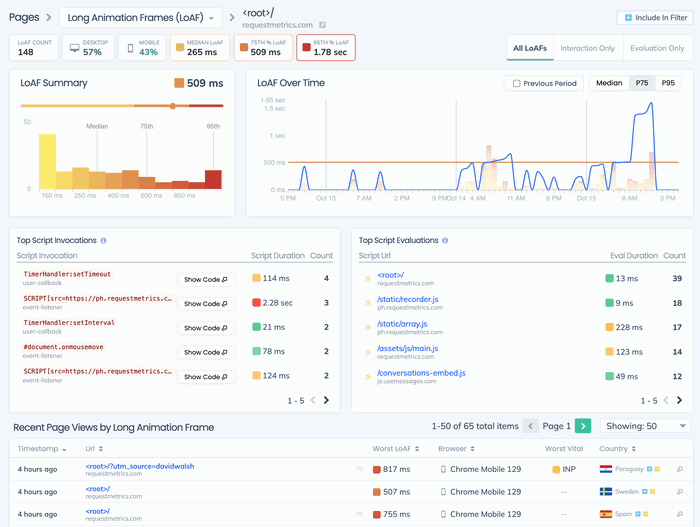
In this screenshot, we can see that there are several 500 millisecond or greater Long Animation Frames, usually caused by inline scripts on the root page. Check out more of what Request Metrics can do with LoAF reports.
How to Fix Long Animation Frames
Fixing Long Animation Frames (LoAFs) requires a mix of identifying common causes and applying specific optimization techniques. The goal is to ensure smooth, responsive interactions while reducing the strain on the browser’s rendering pipeline. Let’s break down how you can address LoAFs and improve your site’s performance.
Common causes of LoAFs
Other than bakers, here are the main culprits of long animation frames:
-
Long JavaScript Execution - Long-running JavaScript tasks block the main thread, preventing the browser from rendering the next frame on time. This can happen when event handlers, timers, or other JavaScript functions do too much work at once. Worse, when multiple tasks pile up within the same frame, the browser may struggle to process them all in the given time, resulting in a LoAF.
-
Large JavaScript Files - Every JavaScript file need to be parsed, compiled, and executed once it’s been downloaded, and this work blocks the main thread during rendering. When a JavaScript file is particularly large or complex, the browser’s processing of it can cause delays, making it difficult to maintain a smooth animation flow.
-
Forced Synchronous Layouts - Changes to the DOM that trigger layout recalculations (like resizing elements, modifying their position, or changing dimensions with JavaScript) can cause significant delays. These recalculations, known as forced synchronous layouts, make the browser perform reflows and repaints that can easily delay frame rendering and cause LoAFs.
Now we’re ready to toast some LoAFs! Let’s look at specific tactics that you can use to fix these problems and optimize your site’s performance.
Optimizing JavaScript Execution
1. Break up long tasks
JavaScript that does too much work at once is a major cause of Long Animation Frames (LoAFs). To fix this, you can break long-running tasks into smaller chunks and distribute them across multiple frames. Use setTimeout or similar techniques to spread out non-urgent work so it doesn’t block rendering.
For example, consider this function that performs some heavy work by counting to a million:
function heavyTask() {
  let countString = "";

  for(let i = 1; i < 1000000; i++) {
    countString += `${i}, `;
  }

  return countString;
}This code will block the main thread for quite some time, as it counts to a million all in one go. We can refactor this to process the work in chunks, allowing the browser to handle other tasks—like rendering frames—between chunks.
Here’s the updated code that spreads the work over multiple frames:
function heavyTask() {
  let countString = "";

  function processChunk(start) {
    const chunkEnd = start + 1000;
    for(let i = start; i < 1000000 && i < chunkEnd; i++) {
      countString += `${i}, `;
    }
    setTimeout(() => processChunk(chunkEnd), 0);
  }

  processChunk(0);
}This version processes the counting in batches of 1000 numbers at a time, returning control to the browser between each chunk. By doing this, you avoid blocking the main thread and prevent any Long Animation Frames from occurring.
Calling setTimeout returns control to the browser, and adds your task to the end of the waiting queue. There is no guarantee that your function will be run in the timeframe you specified. To address this concern, the Google team is trialing a new API called scheduler.yield, which adds your task to the front of the waiting queue, so you have more control on when your task resumes.
2. Minimize work inside requestAnimationFrame
requestAnimationFrame callbacks are invoked just before the browser renders the next frame, so they need to be fast. The purpose of requestAnimationFrame is to make final adjustments to the DOM for the upcoming frame—not to handle extensive processing tasks.
Using requestAnimationFrame as a timing mechanism can be useful because it’s called right before rendering. You can use it to defer lightweight DOM changes until the last moment, ensuring the frame is rendered quickly, while offloading heavier tasks to the next frame.
Here’s an example of how to handle a button click efficiently:
button.addEventListener('click', () => {
  requestAnimationFrame(() => {
    // Quick DOM update in the frame
    button.setAttribute('disabled', 'disabled');

    // Defer the heavy work to the next frame
    setTimeout(processTheClick, 0);
  });
});This code that handles the user clicking a button uses the next frame only to disable the button, then defers all the future work to processTheClick until the next frame.
In this example, the button is disabled during the next frame using requestAnimationFrame, but the actual processing (processTheClick) is deferred using setTimeout so that the heavy lifting happens after the frame is rendered.
3. Avoid work in ResizeObserver and IntersectionObserver
Just like requestAnimationFrame, callbacks to ResizeObserver and IntersectionObserver happen just before the paint event. They exist to give you the ability to respond to a window resize or an element scrolling into view, but it’s dangerous to do too much work here. Doing too much work can result in JavaScript Errors.
Unless your intention is to stop the next frame from happening, it’s a good idea to defer most of the work until the next frame, like this:
new ResizeObserver((entries) => {
  setTimeout(() => {
    dealWithEntries(entries);
  }, 0);
});In this example, we’re using setTimeout to push the actual work to the next frame, allowing the browser to complete its current rendering without delay.
Reducing the impact of large JavaScript files
Large JavaScript files can be a major contributor to Long Animation Frames (LoAFs). When a browser encounters a large JavaScript file, it needs to parse, compile, and execute the file, which can block the main thread and delay frame rendering. Here are some strategies to reduce the impact of large JavaScript files:
1. Code-Splitting
Code-splitting is the process of breaking down a large JavaScript bundle into smaller, more manageable chunks that can be loaded on demand. This allows the browser to load only the JavaScript needed for the current page or interaction, rather than downloading everything upfront.
Modern bundlers like Webpack, Rollup, and Parcel offer built-in support for code-splitting. By loading modules or chunks only when needed, you prevent the browser from overloading the main thread with unnecessary code during critical rendering moments, leading to smoother animations and better performance.
2. Defer JavaScript parsing and execution
Most JavaScript isn’t required immediately when the page loads (or at least it shouldn’t be). You can use the defer attribute to delay the parsing and execution of scripts until your page’s main content is fully loaded. This ensures that non-critical JavaScript files don’t block the browser’s main thread during the rendering process.
<script src="scripts.js" defer></script>Deferred scripts will be parsed, compiled, and executed just before the DOMContentLoaded event. You can further reduce the impact by wrapping your scripts in a deferred event listener:
window.addEventListener("DOMContentLoaded", () => {
  setTimeout(() => {
    //start your script
  }, 0);
});This method allows the structure of your script to be parsed, but yields the main thread to allow other scripts or tasks to complete before execution begins. Deferring scripts helps reduce the likelihood of LoAFs impacting critical animations or interactions.
Remove Forced Synchronous Layouts
One of the slowest things a browser can do is a forced synchronous layout. This is when we change something in the DOM, such as applying a class, then read the properties of the DOM.
Consider this function:
function bigButtons() {
  button.classList.add("big");
  console.log(button.offsetWidth);
}The first line adds a class to a button, which queues up for the browser’s next render cycle. But then, we try to read the offsetWidth of the button. It might be out of date with this new class applied, so it forces the browser to stop what it’s doing and update the layout, right now.
Removing these forced layouts is key to avoiding janky animations and maintaining a smooth, responsive user experience. Here’s how to do it:
1. Batch DOM Updates
Forced synchronous layouts occur when you write to and then immediately read from the DOM. Each time you query a DOM property like offsetWidth or scrollHeight, the browser may need to recalculate the current layout.
To prevent this, batch your DOM reads and writes. First, collect all the DOM measurements you need, then apply your changes afterward. This ensures the browser only recalculates the layout once, minimizing the performance impact.
For example:
const width = element.offsetWidth;
const height = element.offsetHeight;

element.style.width = width + '10px';
element.style.height = height + '10px';By separating the DOM reads and writes, you prevent the browser from recalculating the layout multiple times within the same frame, reducing the chance of triggering a LoAF.
2. Avoid Layout Thrashing
You know what’s worse than a forced synchronous layout? Doing it over and over again! This is called layout thrashing—when JavaScript repeatedly reads from and writes to the DOM in quick succession, often in a loop. This forces the browser to recalculate the layout over and over again within a single frame, causing severe performance issues.
To avoid layout thrashing, separate DOM measurements from DOM modifications, and make sure you’re not causing multiple reflows by reading from the DOM inside a loop.
Here’s an example of how layout thrashing happens and how to fix it:
// Bad: Causes layout thrashing by reading and writing in a loop
for (let i = 0; i < elements.length; i++) {
  elements[i].style.width = elements[i].offsetWidth + 'px';
}

// Good: Batch the DOM reads, then the writes
const widths = [];
for (let i = 0; i < elements.length; i++) {
  widths[i] = elements[i].offsetWidth;
}
for (let i = 0; i < elements.length; i++) {
  elements[i].style.width = widths[i] + 'px';
}By batching DOM reads and writes, you ensure the browser only recalculates the layout once, greatly improving performance and reducing the chance of LoAFs.
3. Use transform for Animations
When animating elements, avoid changing properties that trigger layout recalculations, such as width, height, left, top, or margin. These types of properties force the browser to reflow the entire layout. Instead, use properties like transform, which are handled by the compositing layer and don’t affect layout calculations.
For example, if you want to enlarge an element when the user hovers over it, use transform:
.element {
  transition: transform 200ms ease-out;
}

.element:hover {
  transform: scale(1.2);
}By using transform for animations, you can avoid triggering expensive reflows and repaints, which significantly reduces the risk of LoAFs. Additionally, this is a great way to optimize animations for mobile devices. Transform makes for smooth animations with reduced jank.
Single Page Applications and Long Animation Frames
A lot of modern web applications are built as Single Page Applications (SPAs) or Progressive Web Applications (PWAs), which rely heavily on JavaScript and animations to provide dynamic, fluid user experiences. SPAs and PWAs are powerful for creating responsive and interactive web apps, but they also come with their own performance pitfalls—especially when it comes to Long Animation Frames (LoAFs).
SPAs typically manage a significant amount of client-side rendering, meaning JavaScript is responsible for handling UI updates, transitions, and routing, often without reloading the entire page. While this creates a smoother experience for users, it also means there’s more opportunity for heavy JavaScript execution, repeated layout recalculations, and blocking tasks to stack up and trigger LoAFs.
Common LoAF Challenges in SPAs
-
Complex Component Rendering: In frameworks like React, Angular, and Vue, components may trigger multiple re-renders within the same frame, leading to layout thrashing or forced synchronous layouts.
-
State Management: SPAs often rely on global state management libraries like Redux or Vuex, which can cause additional computation and state reactivity that might block the rendering pipeline.
-
Animations and Transitions: SPAs tend to include a lot of page transitions or UI animations, which, if not optimized properly, can result in janky or slow animations, leading to noticeable LoAFs.
Tactics for Reducing LoAFs in SPAs
-
Optimize Component Updates: Frameworks like React and Vue offer ways to optimize rendering. Use memoization (React.memo, useMemo) or the shouldComponentUpdate method to avoid unnecessary re-renders of components that don’t need to change.
-
Defer Non-Critical JavaScript: Use code-splitting or dynamic imports to load JavaScript modules only when they’re needed, rather than loading all of your app’s code at once.
-
Use requestIdleCallback: SPAs often handle tasks like data fetching or state updates. Using requestIdleCallback allows you to queue non-urgent work when the browser has idle time, minimizing the chance of LoAFs impacting animations.
By understanding the unique challenges SPAs face in managing JavaScript-heavy workloads and animations, developers can take targeted steps to ensure smooth performance and reduce animation jank in Single Page Applications.
Tools to Help Identify and Fix LoAFs
Tracking and fixing Long Animation Frames (LoAFs) can be tricky, especially when dealing with complex web applications. Fortunately, there are several powerful tools available to help you identify LoAFs, analyze their causes, and ultimately fix the performance issues that lead to them.
1. Chrome DevTools
Chrome DevTools is an essential tool for every web developer, and while it doesn’t currently expose LoAFs by default, you can use its Performance Panel to get a detailed breakdown of your site’s frame rendering. By analyzing long tasks, resource loading, and paint events, you can infer when LoAFs are happening and diagnose what’s causing them.
For LoAF-specific tracking, you can extend Chrome DevTools using the Performance API to log and measure LoAFs directly in the timeline. This can be done using a custom DevTools extension or by adding LoAF entries to the timeline via PerformanceObserver.
2. Request Metrics
Request Metrics offers built-in support for LoAF reports, making it easy to track Long Animation Frames from real users and get detailed, actionable insights. Request Metrics gives you:
- A breakdown of which pages and scripts are causing LoAFs.
- Real-time data from real users (field data) to identify LoAFs under real-world conditions.
- Performance insights into interaction delays, animation jank, and other Core Web Vitals metrics like INP (Interaction to Next Paint).
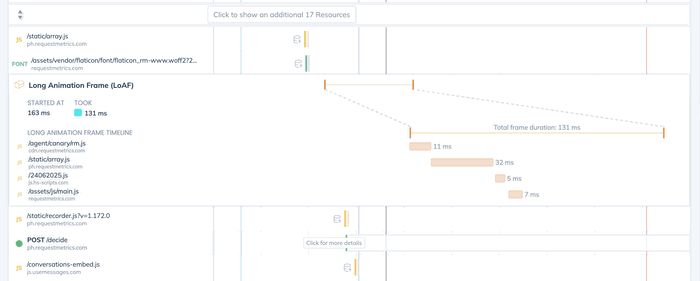
The ability to track LoAFs from Real User Monitoring (RUM) in Request Metrics helps ensure you’re seeing the real impact of performance issues on your users.
3. Web Vitals Extension
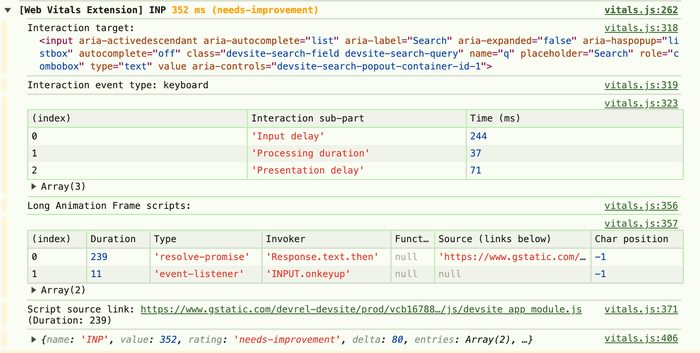
The Web Vitals Extension from Chrome provides lots of valuable performance information about your current session, including Long Animation Frames. It reports the Core Web Vitals, including any LoAF reports that impact your Interaction to Next Paint (INP) scores.
The Last Slice of the LoAF
Toasting Long Animation Frames (LoAFs) isn’t just about making your website run faster—it’s about delivering a smoother, more responsive experience that keeps users engaged and happy. By reducing animation jank and optimizing your site’s performance, you’re ensuring that users can interact with your content seamlessly, without frustrating delays.
Whether you’re dealing with heavy JavaScript execution, forced synchronous layouts, or unoptimized animations, the key to solving LoAFs is identifying the root causes and applying targeted solutions. Tools like Request Metrics, Chrome DevTools, and the Web Vitals Extension make it easier than ever to track LoAFs, analyze their impact, and take action to fix them.
Web Performance is essential. So slice off the jank, butter your animations with care, and serve up a website that’s as smooth as it is fast. Happy toasting!


