Your PageSpeed is about to blast-off
Accelerate your website's PageSpeed scores and deliver amazing performance experiences for your users.
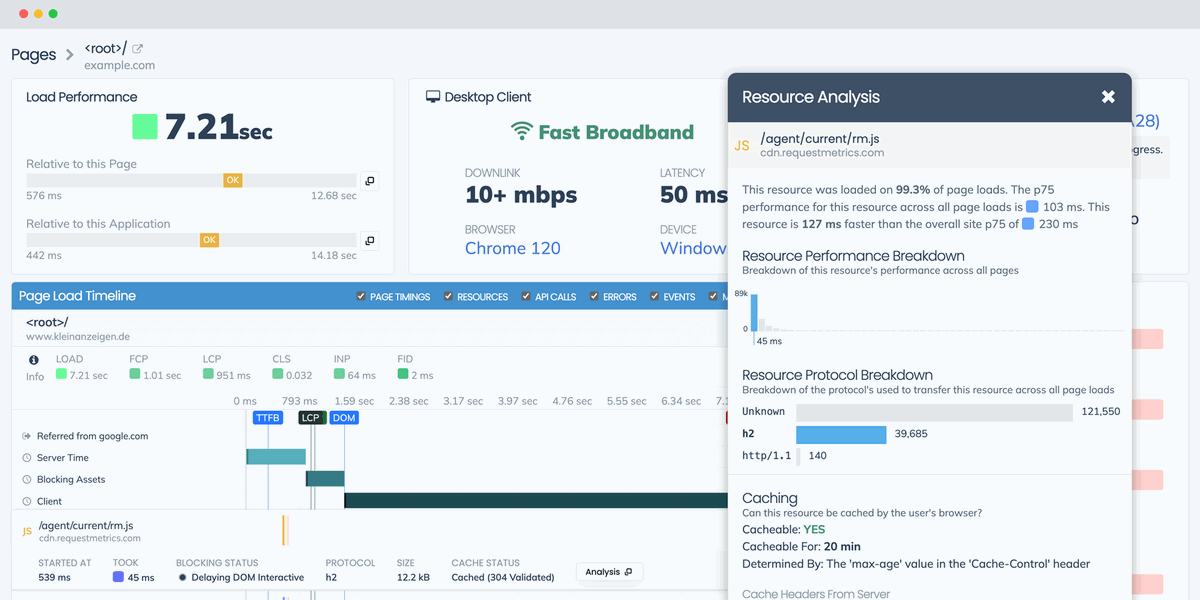
-
Delight your users
User's stay longer and purchase more from fast websites and stores. Boosting your PageSpeed makes users happy and increases your revenue.
-
Less developer time
Point your developer team right at the problem with our reports and reduce engineering time from hours to minutes.
-
Fix problems fast
Get notified of performance problems before Google notices or rankings are impacted.
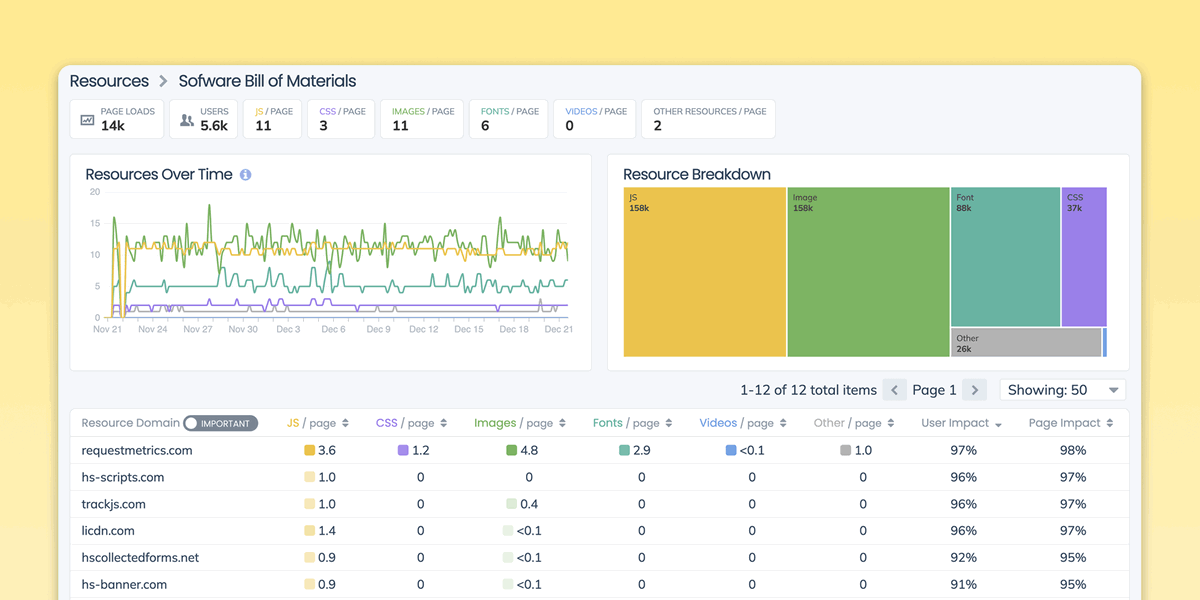
Identify slow third parties
Find the vendors, marketing pixels, and other cruft that's slowing down your website and irritating your users.
-
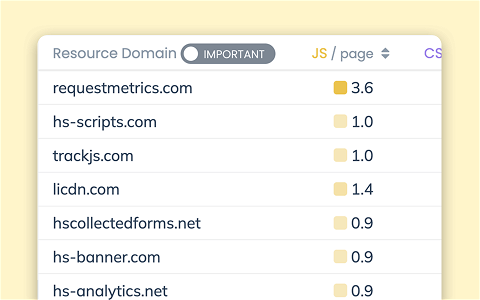
Automatic noise filter
Remove the noise from third-parties injected by crawlers and browser extension automatically, and focus on things you control.
-
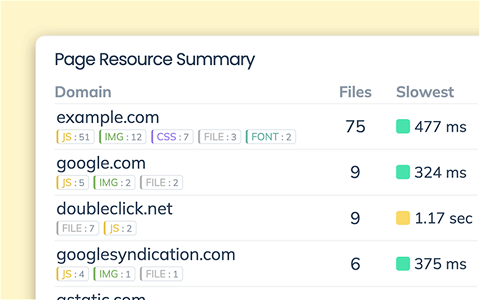
Biggest and slowest
Highlight the biggest and slowest vendors on every page viewed and zoom to all the resources they're pushing into your site.
-
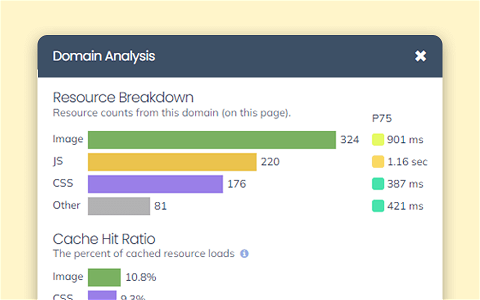
Vendor assets and caching
Find ways to boost the speed of your vendor assets with caching and protocol breakdowns.

Request Metrics helped me quickly identify and resolve a crippling performance issue.

Track custom marks and measures
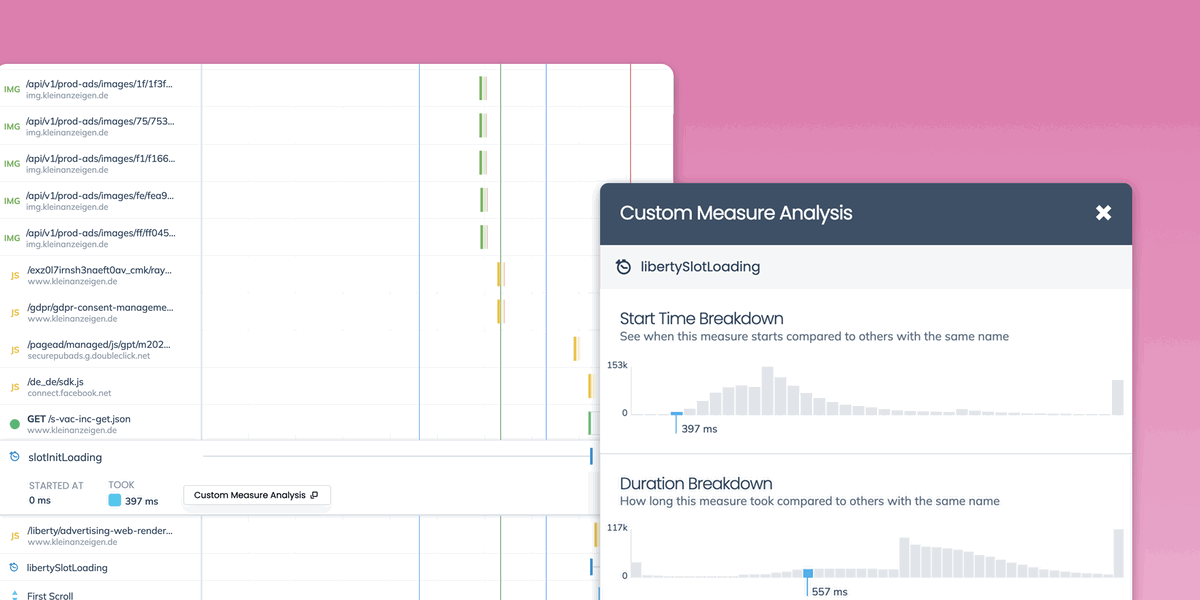
Dive into detailed performance information with your own custom performance marks and measures, captured automatically from the performance API.
-
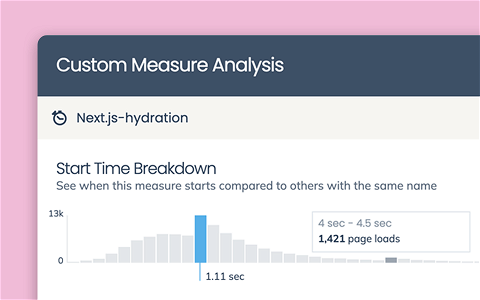
Mark distribution
See when your marks start and finish in the waterfall sequence.
-
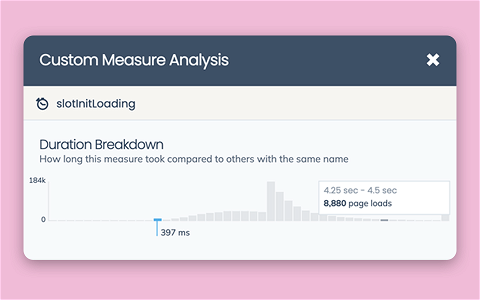
Measure durations
Understand how your performance marks behave across thousands of visitors and pages.
-
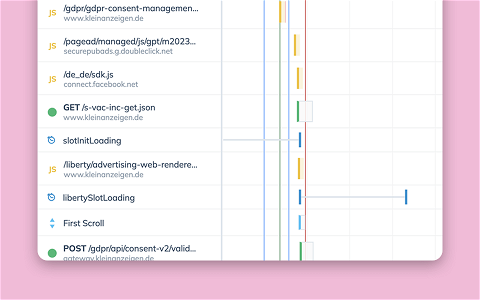
Marks and measure waterfall
See your custom marks and measures inline with resources, events, and other important metrics in the load sequence.

Request Metrics showed us all the unused marketing pixels and vendor rubbish that was slowing down our users.

Analyze your dependencies
Visualize all of your website dependencies, resource, and third-party scripts as individual or aggregated loading waterfalls.
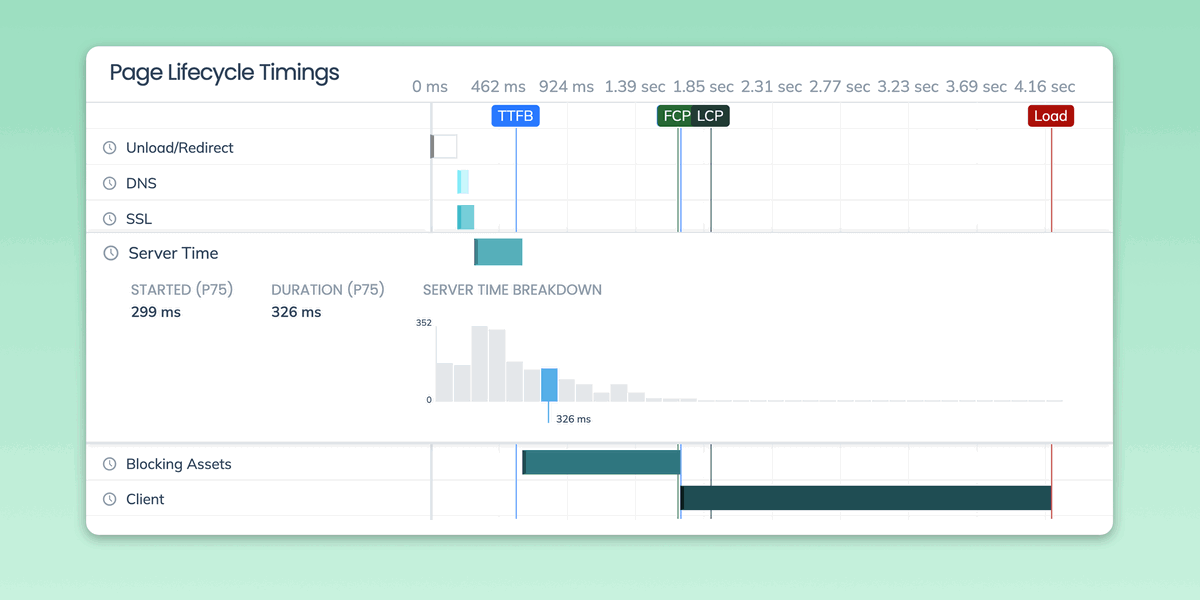
-
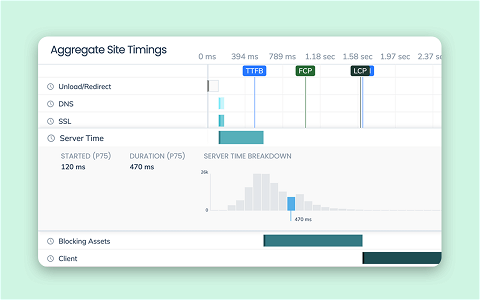
Aggregate page timings
Discover the slowest part of your website loading process.
-
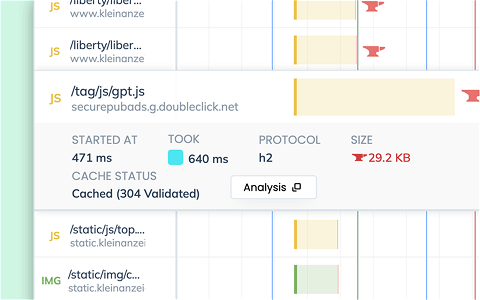
Dive into each resource
Understand exactly what is making each asset slow.
-
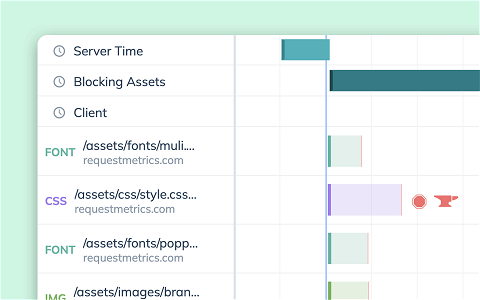
Highlight blocking and big
Flag the biggest and blocking resources that impact performance the most.
