
Launching Resource Performance Monitoring
What is the slowest part of your website? Most of the time, it’s the resources: all the CSS, fonts, images, and JavaScript that powers your webpage. Resources that are too big or too slow are often the root cause of slow Core Web Vitals.
This week, we’re releasing a bunch of new tools and reports to better understand your web resources, how they impact your website performance, and where you have opportunities to improve. I think it’s going to help a lot of folks build better, faster websites.
Resource Domains
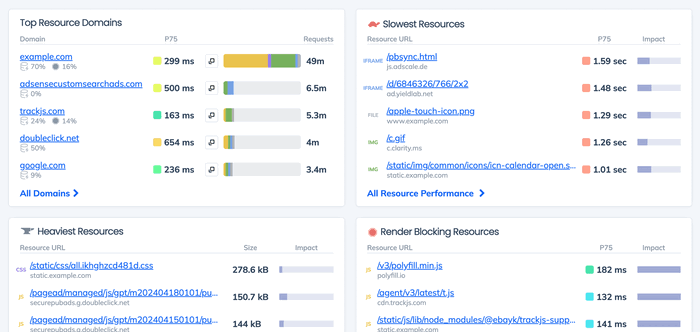
Our new resource dashboard features your Top Resource Domains. This is important because it shows all the third-party vendor domains that your website depends on, and how much they impact the overall performance of your site.
The report shows the overall performance of all requests to that domain, what sort of files are served, and how many total requests were made.
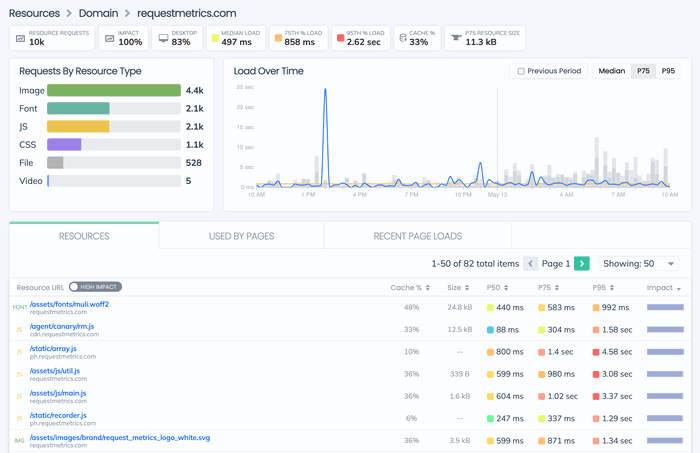
You can drill in further on any of the domains to see a full rundown of that domain’s performance, the individual resources it hosts, and what pages in your website depend on it.
Slowest Resources
The dashboard also shows you the Slowest Resources on your website. We filter through the noise and remove resources that are rarely used or injected by extensions, so you can focus on the resources that have a real impact on your Core Web Vitals and performance.
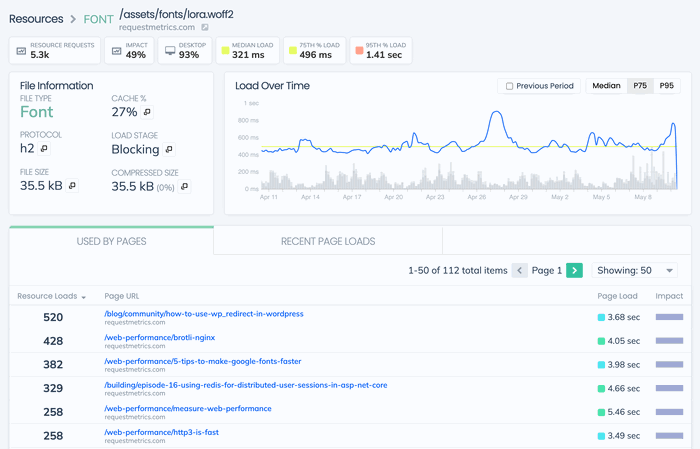
Every resource has its own breakdown showing the details about how it is served, how often it gets cached, the performance over time, and what pages it gets used on.
Heaviest Resources
The most common performance problems are resources that are too big for the web. The new Heaviest Resources report shows you exactly where the big resources are, listing all of your resources by size, and prioritizing them based on the impact they have to the overall website.
Blocking Resources
Some resources hurt your web performance more than others — particularly blocking resources. Blocking resources are loaded right at the start of your website, and prevent the page from rendering. Most often, these should only include the critical CSS and fonts you need to style the page.
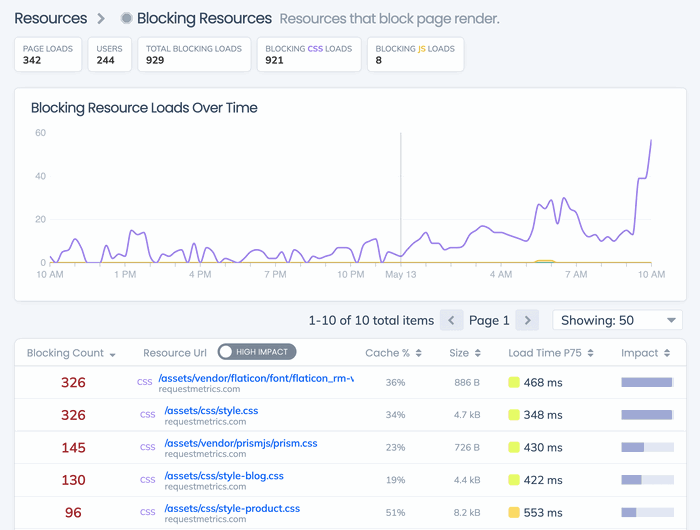
Reducing the number of blocking resources by deferring when they load is a great way to improve your web performance. If you don’t depend on JavaScript, then there definitely shouldn’t be any blocking JavaScript resources.
New and Removed
This might be my favorite new resource report: the New and Removed resources. It’s like a code-diff for your website, listing all the resources that have been added or removed from real requests recently, and their impact on performance
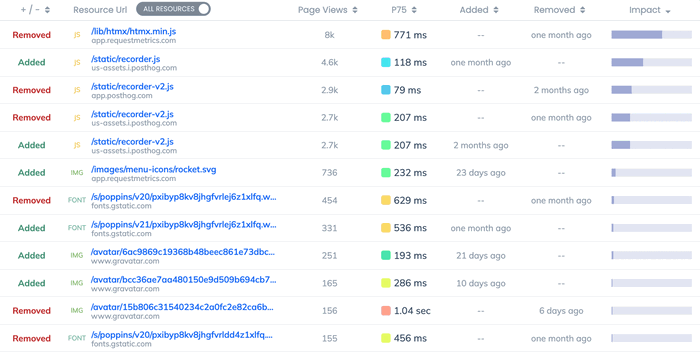
Did one of your vendors change their implementation? Did another team add things with Tag Manager? Did the latest release change the overall performance? This new report can answer all of those questions easily!
Monitoring resource performance is a powerful and insightful way to explore your website performance. All of these reports are live in Request Metrics now, so grab your free web performance trial and give them a try!
This was our first pass at resource monitoring, and we have more ideas on the way! If you have ideas or suggestions, please let us know how we can help make your website fast!


