Announcing Custom Metadata Reports & Filters
We just released support for custom metadata in Request Metrics! Metadata allows you to describe your user, session, application, environment, account, A/B Test, or whatever else is meaningful for you. You can add metadata through the browser agent API, and report & filter on it in the Reporting UI.
Metadata is added through the Browser Agent API like this:
RM.addMetadata({
  "subscription": "professional"
});
This adds the metadata key “subscription” with value “professional” to the current page load, as well as any activity, events, or errors that occur during it.If this happens to be the first page view of a session, it will also add it to the session’s metadata.
You can add extra metadata to custom events and errors by passing additional metadata to the browser agent:
RM.sendEvent("checkout", {
  "method": "credit"
});
The metadata is additive, so an event like the “checkout” event above would have the page’s “subscription” metadata, as well as the event’s “method” metadata. Check out all the details in our docs!
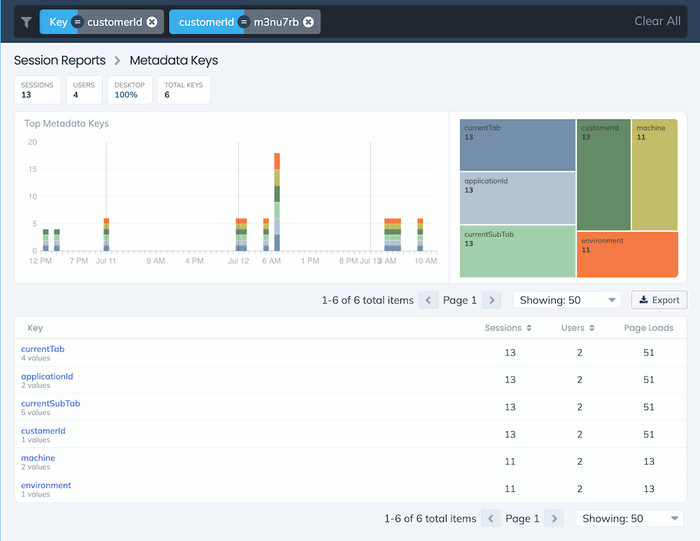
Throughout the UI, you can filter every report, every screen, and every chart by metadata using the Filter bar. There are also dedicated metadata reports. Using these together enables you to do interesting breakdowns, like “show me all the “method” metadata values for “subscription:professional”. There are so many possibilities!
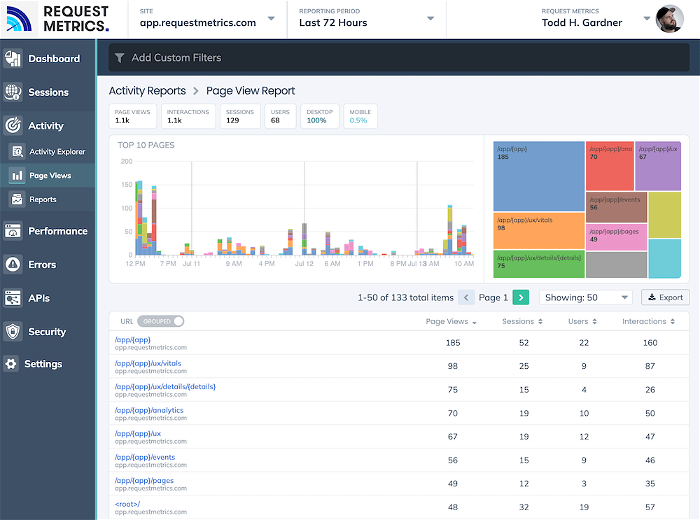
We also launched a bunch of minor updates, including a new Page View report that combines both the “hard” page load events with the “soft” navigation events that happen in single-page applications. This allows you to get a comprehensive view of your traffic, even if you use a combination of client-side and server-side rendering (like we do 😀).
All our URL reports can now toggle between the “grouped” URLs and the “original” URLs. This allows you to decide how you want to break down your traffic to understand either the system structure, or your content.
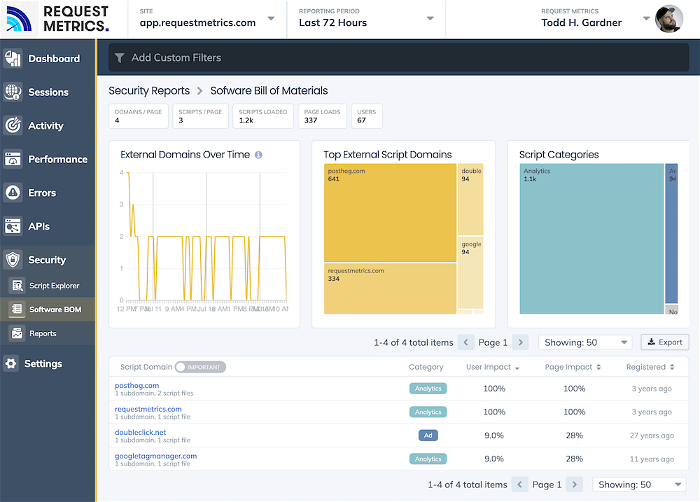
Lastly, we updated the Software Bill of Materials report to surface the top-level domains first, and filter out the noisy things that come from one-off users and browser extensions. We think this will be a lot more valuable to understand your real vendor exposure.
What should we build next?


