Frontend vs Backend Performance: Which is Slower?
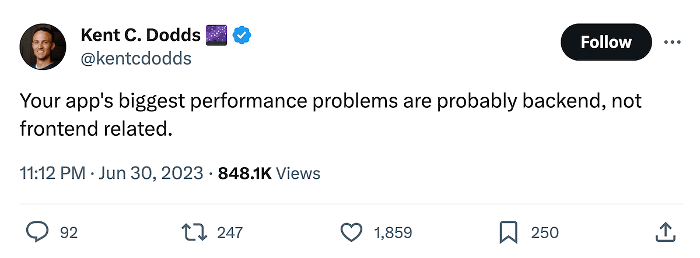
Kent C Dodds made a claim on Twitter (X) that the “biggest performance problems are probably backend, not frontend related.” Is this true? Some websites have slow backends, for sure. Others have slow frontends. A few unfortunate sites are slow in both. But as of today, right now in 2026, which is the bigger performance problem for most teams, the frontend or the backend?

I wanted to explore it with some real data from the web. Fortunately, as the perveyor of a web performance monitoring platform, I have access to just the right sort of data.
Why is this important?
Remember the Pareto Principle (AKA the 80-20 rule)? 80% of the gains will come from 20% of the work, especially when it comes to performance. Finding the right 20% to work on is a big part of the problem. Should you spend time optimizing the database, shrinking JavaScript bundles, or implementing new compression? You don’t need to do everything, but you need to do the right things.
By exploring this data, I want to show you how we analyze and interpret performance data so that you can focus on the 20% of the work that will have the biggest impact to your team and your business.
TL;DR: Show Me the Data
Based on Real-User data sampled from Request Metrics and the Chrome User Experience Report, the frontend accounted for over 60% of experienced load time. While there will obviously be variations for each website, I believe Kent is incorrect and the biggest performance gains continue to be on the frontend.
| Server | Blocking Asset | Client | Page Load | |
|---|---|---|---|---|
| P75 | 654 ms (12%) | 541 ms (10%) | 3,509 ms (67%) | 5,274 ms |
For most sites, the biggest performance problems are on the frontend.
How To Measure Performance
Web Performance is most often measured using synthetic testing tools like WebPageTest, Lighthouse, or PageSpeedInsights. Testing performance like this is tempting because it returns instant results. But those results only represent “best case” and are usually imaginary. They report how fast things were once, just now, from wherever you ran the test.
The most accurate way to measure performance is through Real-User Monitoring, or RUM. Google also refers to this as “field testing” performance. RUM tools gather the performance metrics from the actual users that visit your website, and show you statistics on what your typical user experiences. For this post, we are looking at Real-User data collected by Google and Request Metrics.
Important Metrics
Time to First Byte (TTFB)
Time to First Byte, or TTFB, is the time it takes for the user’s browser to receive the first byte of data from the backend. It measures the performance time that the browser is exclusively blocked by the backend to prepare all the processing, data lookups, and constructing the start of the HTML response stream. When planning to optimize your backend performance, monitoring the real user TTFB times can tell you whether your work is having a real effect on the end users.
First Contentful Paint (FCP)
The First Contentful Paint, or FCP, measures the time it takes for the browser to perform the first meaningful paint action in loading your website. This will usually be things like setting a background color or rendering initial header text. It’s an important user experience measurement because it is the first indication to the user that their request will eventually be completed.
FCP is a measurement of both the frontend and the backend. It is influenced by how long the backend takes to return enough HTML markup and resources for the rendering process to start as well as whether the frontend is structured to begin rendering as soon as possible. We wrote up a bunch of tactics that you can use to analyze and improve your FCP scores.
Largest Contentful Paint (LCP)
The Largest Contentful Paint, or LCP, measures the time it takes the browser to render the largest element on the page, by pixel area. It is one of Google’s Core Web Vital metrics, influencing the pagerank of websites because it measures how long until the most important content is visible to the user.
The difference between FCP and LCP is almost entirely a measurement of frontend performance, like the prioritization of resources, organization of markup, and user experience design. Learn more about using and measuring LCP.
Page Load Time
Page Load is the “old school” way of measuring performance. It’s simply how long it takes until the “load” event fires on the page. Modern performance has moved away from using page load because it is very inconsistent: some sites load very fast, but feel very slow because all the work is asynchronous. However, not all browsers support modern metrics like TTFB, FCP, and LCP, so it is still valuable for comparison.
Frontend vs Backend
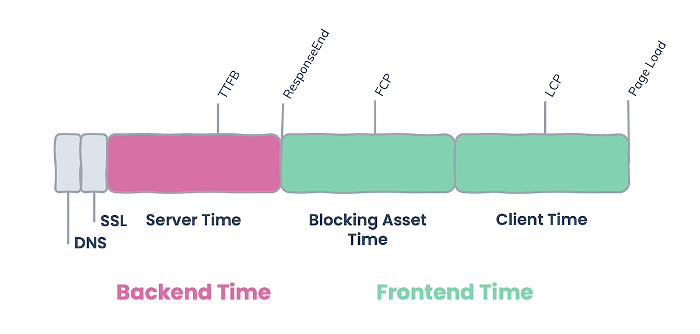
Using these metrics, and a few other tricks, we can measure the performance impact of the frontend and backend code separately. Here’s a (simplified) sequence of how these metrics relate to each other, and how the backend and frontend are represented.

We can measure backend performance by considering all the time until the responseEnd, and frontend performance as everything after. There’s a lot more nuance to this loading sequence if you want to dive in deeper, but this should give us some rough numbers.
Exploring the Data
RUM Data from Request Metrics
Request Metrics collects detailed performance data from every kind of web browser, giving us a really good picture of how performance breaks down. For this experiment, we sampled 300 million visits across our customer base of content publishers, e-commerce stores, and software applications from the last 30 days.
We broke out the data into 3 buckets of time:
- Server Time, all the time between the
startandresponseEndevent, while the browser is downloading request data. - Blocking Asset Time, the time between
responseEndanddomInteractive, while the page is waiting for critical resources like CSS to be loaded. - Client Time, the time between
domInteractiveand theloadevent. This includes downloading images and executing blocking JavaScript.
For each of these buckets, we pulled percentiles to understand the range of experiences:
- Median, half the users experience this or faster.
- P75, 75% of users experience this or faster. This is the number that Google users to qualify the performance of websites.
- P95, 5% of users experience this or slower, representing the “worst” experiences.
Here’s our data, the numbers shown represent the time spent in each loading phase, and their percentage of the total page load.
| Server | Blocking Asset | Client | Page Load | |
|---|---|---|---|---|
| Median | 323 ms (13%) | 237 ms (9%) | 1,294 ms (51%) | 2,526 ms |
| P75 | 654 ms (12%) | 541 ms (10%) | 3,509 ms (67%) | 5,274 ms |
| P95 | 2,467 ms (14%) | 1,834 ms (11%) | 13,223 ms (76%) | 17,375 ms |
Within this sample, not only is frontend performance is bigger problem than backend, but it is dramatically so at all percentiles. Even excluding blocking asset load time, which can usually be solved with caching, compression, and protocol improvements, the JavaScript execution and image load time represents a majority of the load time for pages.
Obviously, not every website is the same. Breaking out the data, there are indeed a few sites where Server Time represents more than 50% of load time, but this represents only 18% of the sample.
Public Data from the Chrome User Experience Report (CrUX)
The data from the Chrome User Experience Report (AKA CrUX) represents a much larger sample of traffic and websites, but only to publicly-accessible websites and only visits with the Chrome browser.
CrUX is publicly-accessible via Google BigQuery. I pulled the P75 scores by device for the top 1 million domains as of 2023-09-01. Here is my query:
SELECT
  device,
  AVG(p75_ttfb) as TTFB,
  AVG(p75_fcp) as FCP,
  AVG(p75_lcp) as LCP,
  AVG(p75_ol) as PageLoad
FROM `chrome-ux-report.materialized.device_summary`
WHERE date = "2023-09-01"
  AND rank >= 1000000
GROUP BY device
Here’s the results, the numbers show the point in the loading sequence where each metric was recorded.
| TTFB | FCP | LCP | Page Load | |
|---|---|---|---|---|
| phone | 1,203 ms | 2,207 ms | 2,730 ms | 2,526 ms |
| desktop | 971 ms | 1,748 ms | 2,245 ms | 3,470 ms |
The CrUX data only captures these individual metrics, not the time spent in each phase unfortunately, so we’ll have to make some inferences. If we assume that TTFB time is all backend, and half of the remaining FCP time waiting for the response to finish. The remaining time until load is all frontend time. Here is that data:
| Backend | Frontend | Total | |
|---|---|---|---|
| phone | 1,705 ms (35%) | 3,140 ms (65%) | 4,846 ms |
| desktop | 1,359 ms (39%) | 2,111 ms (61%) | 3,471 ms |
For the 75th percentile of visitors in this CrUX sample, over 60% of the load time is spent on the frontend, which is remarkably close to the data we pulled from the Request Metrics sample.
For most sites, the biggest performance problems are on the frontend.
YMMV: AKA “It Depends”
Obviously, it depends. Does this mean you should drop your backend performance work and refocus? Of course not. Every application is different, and your problems are not necessarily the same as anyone else.
To truly understand the performance bottlenecks of your application, it is essential to gather your own performance data. By doing so, you can focus your time and energy on fixing the biggest problems specific to your website. If you’re trying to speed up your system, do you know which parts are actually slow?
Performance is not Constant
Despite what you get from many “performance tools”, performance is not a one-time test that you can simply run and forget about. It is a constantly changing aspect of your application, influenced by different users, traffic patterns, and times of the day. To know your site is fast, you have to monitor the real user performance over time.
Real User monitoring tools like Request Metrics help you understand your performance, and how it changes over time. When things slow down, it helps you focus your efforts on the things that will matter the most.
Optimizing Frontend Performance
Since frontend performance is important to so many sites, I wanted to do a quick checklist of the most beneficial things you can do to boost your frontend performance:
1. Caching All the Things.
The best way to make your site faster is to do fewer things. Caching is great at that, because you tell the browser to remember what it already did last time. Check out how to check and apply caching settings to your requests.
2. Image Optimization
Images are one of the largest resources in most websites, even if you’re using obnoxious amounts of JavaScript. Optimizing your images to use the right formats, compressions, and sizes can make huge impacts in the overall performance of your site. Check out our writeup on optimizing images for performance.
3. Use Modern Compression
The vast majority of your site is made up of resources like images, CSS, and JavaScript files. You can dramatically reduce the transfer time for these resources by using modern compression techniques like Brotli instead of gzip (or worse, no compression at all). Compression can usually be added via configuration of in your web server or CDN. Here’s how to enable Brotli with nginx, which we use for lots of things at Request Metrics.
4. Use HTTP/3
Even if you have images that are too big, JavaScript that is too dense, and too many resources on your pages, you can still make things a lot faster by using modern transport protocols like HTTP/3. Yes, HTTP/3 is dramatically faster. Like compression, this is usually configured on your web server.
Conclusion
After analyzing the web performance data from millions real users, we see that the frontend accounts for more than 60% of web application load time. Frontend optimizations such as caching, compression, and optimizations remain the biggest benefits for most websites.
While frontend performance problems remain the biggest issues for most sites, it is not the biggest issue for everyone. Clearly some sites will have a blazing fast frontend and a terribly slow backend.
You need to understand where your performance problems are, and the best way to do that is with Real User Monitoring. A tool like Request Metrics will automatically gather the performance experiences from your users, and give you a real-time view into how your stuff works.


