

The Chrome User Experience Report (CrUX)
Everyone in web performance talks about CrUX—what the heck is it?! CrUX, or the Chrome User Experience Report, is Google’s initiative to measure how websites perform for their real users. It’s not just another test, it’s a window into the actual experience people have when they visit a site.
Wait—didn’t Googlebot and PageSpeed Insights already do this? Are they going away?
Not exactly. Googlebot and PageSpeed Insights both check your website’s performance, but they aren’t measuring what real users are seeing. Those tools are what we call Lab Testing—robots crawling your site from Google’s fast data centers. They do important checks, but they aren’t dealing with the reality of slow connections and old devices that real people use.
CrUX, on the other hand, is a Field Test. It gathers data from real people browsing the web. Whether someone’s streaming your site on a fiber connection or struggling through 3G, CrUX captures their performance data and tells Google how fast and stable the site really is for actual users.
Field data shows the truth about a site’s speed and stability, not just what developers hope is happening in the best-case scenario. Google uses this data to evaluate how well a site performs in the real world—because if it’s slow for users, Google wants to know about it.
Using PageSpeed Insights alone is Hope-Driven Performance. Get real user data before deciding if your website is fast enough.
Get your free speed check to see your website performance for real users.
Free speed test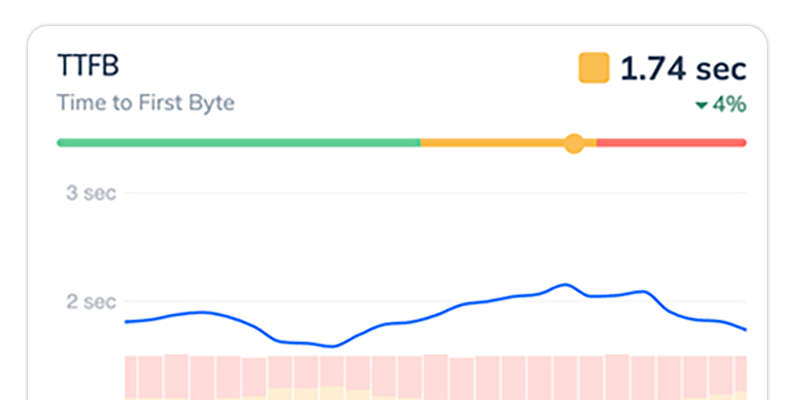
Why is User Experience Important?
Why does Google care about any of this?
Simple, users stay longer on websites that are faster and easier to use. That’s fewer bounces and better searches. And when searches are better, Google wins.
You can win too. UX directly impacts SEO and ad performance.
- SEO: Google uses UX (via CrUX) as a ranking factor. Fast, smooth sites rank higher. Slow or frustrating ones get pushed down.
- Advertising: Slow sites waste your advertising spend. Poor UX drives users away before they even convert, meaning you’re losing money and engagement. You paid for a click, but they bounce.
In the end, Google uses CrUX to reward fast, user-friendly sites—and punish those that aren’t.
A Quick History of CrUX
The Chrome User Experience Report (CrUX) was launched by Google in 2017. Before CrUX, Google relied heavily on lab testing—tools like Googlebot and PageSpeed Insights. These tests ran in controlled environments, using fast hardware and stable networks. But that wasn’t what real users were experiencing, especially in parts of the world where slower connections and older devices are more common.

The lab data just wasn’t good enough to be a true ranking factor. Google needed something more accurate, something that reflected how users across the world actually felt about a website’s performance.
Enter CrUX, stage left. Since Google owns Chrome, they could pull performance data straight from the source—real users browsing the web. CrUX became Google’s solution for tracking user experience on a global scale, using data from millions of Chrome users to understand how well websites actually perform in the wild.
What the Chrome UX Report Measures
CrUX tracks several key performance metrics that show how users experience your site in real-world conditions. These metrics fall into three categories, with Google’s Core Web Vitals being the most critical.
Core Web Vitals
Google’s Core Web Vitals are the primary indicators of a good user experience. These metrics are directly tied to SEO rankings, measuring key aspects like loading speed, visual stability, and interactivity:
- Largest Contentful Paint (LCP): How long it takes for the largest visible element (like an image or text block) to load.
- Cumulative Layout Shift (CLS): How much the layout of the page dances around during loading. Unwanted jumps frustrate and confuse users.
- Interaction to Next Paint (INP): How quickly your site responds to user interactions, such as clicking or typing.
Other Web Vitals
In addition to Core Web Vitals, CrUX tracks other performance metrics that provide deeper insights into content loading speed and server response efficiency:
- First Contentful Paint (FCP): Measures the time it takes for the first piece of content (like text or images) to appear on the screen.
- Time to First Byte (TTFB): Tracks how long it takes for the browser to start receiving data from the server after making a request.
Legacy Metrics
Before Core Web Vitals became the standard, older metrics like DOMContentLoaded and onload were commonly used to measure performance. While less critical today, they can still offer useful insights, especially for non-Chrome browsers:
- DOMContentLoaded: Measures the time it takes for the HTML document to be fully loaded and parsed, before resources like stylesheets, images, and subframes finish loading.
- onload: Tracks the time when all elements on the page—HTML, images, scripts, and styles—have fully loaded. It’s a broader metric, but it doesn’t account for interactivity or layout shifts.
Where Does CrUX Data Come From?
The Chrome User Experience Report (CrUX) pulls data straight from the source: real, authenticated Chrome users. Every time someone visits a website using the Chrome browser, it anonymously collects the UX metrics from them.
How Google Collects CrUX Data
Google gathers this data from Chrome users who have opted in to data-sharing. You know that giant wall of text you agreed to? It’s in there.
Is Google Collecting data from me right now? Maybe. Are you using Chrome? Are you logged into Google? Did you blindly click “accept” when installing Chrome?
It’s completely anonymous, and no personal or identifying information is included. Instead, CrUX focuses purely on performance metrics—things like load times and layout stability—across a wide variety of devices, networks, and regions.
Website Requirements
CrUX only measures websites that are publicly accessible and have a sufficient level of traffic. This means if your site is private or receives very low traffic—like a personal blog or an internal company website—it might not be included in the dataset. CrUX focuses on popular, public websites to provide performance data that impacts the most users.
What Devices and Networks Does CrUX Cover?
CrUX pulls data from a huge range of devices and networks—everything from high-end desktops on fiber connections to budget smartphones on slow 3G networks. This diversity helps ensure that the performance metrics reflect all types of users, not just those with ideal conditions.
Limitations of CrUX Data
While CrUX provides valuable insights, it’s important to note a few limitations. First, it only collects data from Chrome users, so you won’t get performance metrics from users on browsers like Safari or Firefox. iOS users are not included either, as Chrome for iOS cannot collect this data yet due to Apple’s privacy restrictions.
How to Access the Chrome UX Report
There are several ways to access CrUX data, depending on how deep you want to go. Most of them are not very intuitive though—that’s why we built the free Speed Check tool.
PageSpeed Insights
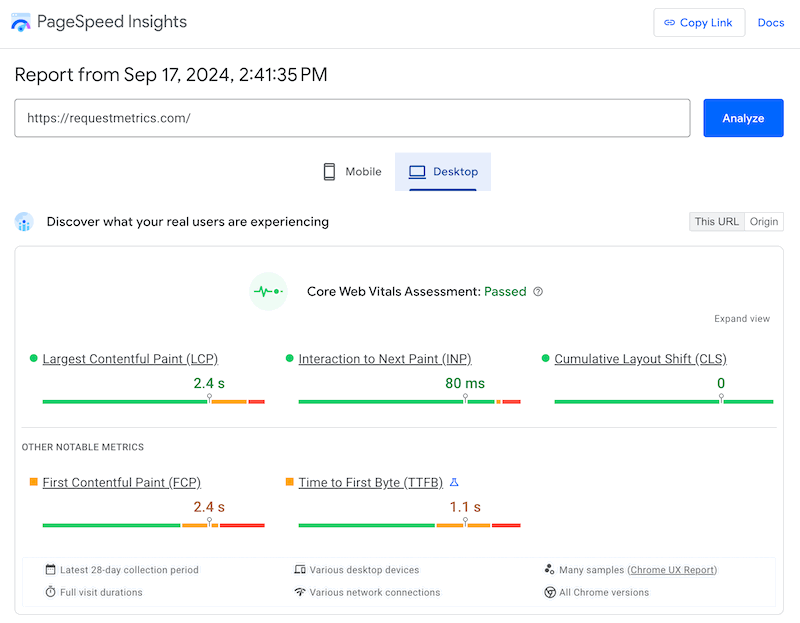
The easiest and most common way to access CrUX data is through PageSpeed Insights. While primarily a lab testing tool, PageSpeed Insights also pulls in real-world CrUX data. It gives you a quick overview of your site’s Core Web Vitals, blending both lab and field data into one report. This is a great way to get a snapshot of how your site performs for actual users and where improvements are needed.
CrUX Dashboard in Looker Studio
If you use Looker Studio for other analytics, this is a good option. Google provides a CrUX Dashboard for a single origin. You can get detailed metrics for your website with charts for each metric, broken out for mobile and desktop.

Querying CrUX Data with BigQuery
For advanced users or developers who want to ask specific questions, you can query CrUX data directly using BigQuery. This gives you access to the raw CrUX dataset, allowing you to run custom queries and analyze performance data at a deeper level. It’s a powerful tool for those who want to do advanced performance tracking or integrate CrUX data into their own workflows.
Request Metrics Speed Check Tool
These options can either be limited or overly complex. That’s why we built the Request Metrics Speed Check tool to make things simpler. Our tool pulls in CrUX data and delivers an easy-to-read report on your Core Web Vitals and other performance metrics. It’s designed for simplicity, so you don’t have to mess around with dashboards or queries—just run Speed Check, and you’ll instantly see how your site (or your competitors) are doing in the real world.

Things to Do with CrUX Data
Once you have access to CrUX data, now what? CrUX provides valuable insights into how your website performs for real users, but knowing how to act on that data is key. Here’s how you can use CrUX data to improve your site’s performance:
1. Identify and Prioritize Performance Issues
CrUX helps you pinpoint the specific performance issues that are impacting your users, like slow Largest Contentful Paint (LCP) or unstable Cumulative Layout Shift (CLS). Once you know what’s causing problems, you can fix what’s hurting users the most. For example, if your mobile users are experiencing slower load times than desktop users, mobile optimization should be your top priority. Focus on the changes that will make the biggest impact.
2. Benchmark Performance Against Competitors
CrUX data is public, so you can look any anyone’s metrics. Even your search competitors! Use CrUX to compare your performance against your search competitors or others in your industry. This helps you see where you stand in terms of user experience and SEO. Benchmarking your performance against competitors gives you a clear goal for where improvements can take you—and how you can gain an edge.
3. Track Improvements Over Time
CrUX data is continuously updated as more users visit your site, giving you the ability to track how your performance changes over time. As you optimize things like LCP or CLS, you can monitor the impact of those improvements on real-world user experience. This ongoing feedback loop helps ensure your site keeps getting better for users.
CrUX vs RUM (Real User Monitoring)
While CrUX is data from real users, it’s not the same thing as Real User Monitoring (RUM). For best results, you should use CrUX to augment and verify the data you get from RUM. Here’s why.
Differences Between CrUX and RUM
- CrUX provides aggregated, public data from Chrome users across the web, giving a broad overview of how sites perform based on Core Web Vitals and other performance metrics.
- RUM tools, like Request Metrics, track detailed, site-specific data in real time. RUM captures session-level insights for all users, across all browsers, giving you a complete picture of your site’s performance.
CrUX is great for benchmarking against competitors, but it lacks the real-time granularity that RUM offers. CrUX provides a delayed, high-level view, while RUM gives you immediate insights and session-specific data to help you respond quickly to issues.
Limitations of CrUX
CrUX has a few important limitations:
- 28-Day Delay: CrUX data is aggregated over the past 28 days, so any changes you make to your site won’t show up immediately. This delay makes it harder to track the impact of optimizations in real time.
- Chrome-Only Data: CrUX only collects data from Chrome users, leaving out users on browsers like Safari or Firefox, which are significant, especially for mobile users on iOS.
- Aggregated Data: CrUX data is high-level and aggregated, meaning you see trends but not the individual user sessions or specific problems that might be affecting your site’s performance.
Why Combine CrUX and RUM
CrUX and RUM complement each other to give you a comprehensive view of performance:
- CrUX is useful for benchmarking and tracking long-term trends across a broad set of users, helping you see how you stack up against competitors.
- RUM provides real-time, session-specific insights across all browsers and devices, allowing you to catch issues early and respond to changes quickly.
By using CrUX to validate and benchmark your performance and RUM to monitor real-time data, you can cover all your bases and ensure your site performs optimally for all users.
Request Metrics and CrUX
Request Metrics is a Real User Monitoring tool that integrates CrUX so you can track your progress and benchmark against competitors. It’s the best of both worlds, really. Our reports give you a comprehensive view of how your site performs in the real world, so you can stay ahead of the competition and deliver the best user experience possible.
Check out our CrUX reports for free with our Speed Check tool, or start a free trial of our Real User Monitoring so we can help make your website the fastest it’s ever been.


